Data Range: Last 14 days
Candle Type: 1 Hour (1H)
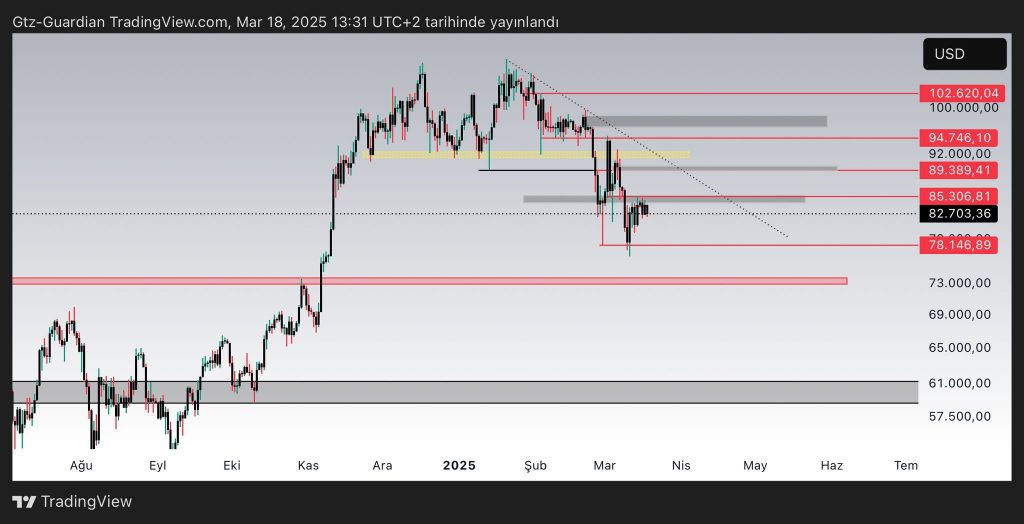
🔹 1. Price & Volatility Metrics
-
Average Hourly Price (OHLC Mean): $100,452
-
Average Hourly Volatility: 0.55%
This indicates an average 0.55% price fluctuation per hour.
🔹 2. Realized Price Metrics
-
STH (Short-Term Holder) Average: $98,622
-
LTH (Long-Term Holder) Average: $48,119
-
STH-LTH Spread: $50,503
This large spread suggests short-term investors have significantly higher cost bases — a typically bullish structure.
🔹 3. Net Unrealized Profit/Loss (NUPL)
-
Average NUPL: 123.47%
Indicates that most on-chain BTC are in significant unrealized profit, signaling a potential realization risk.
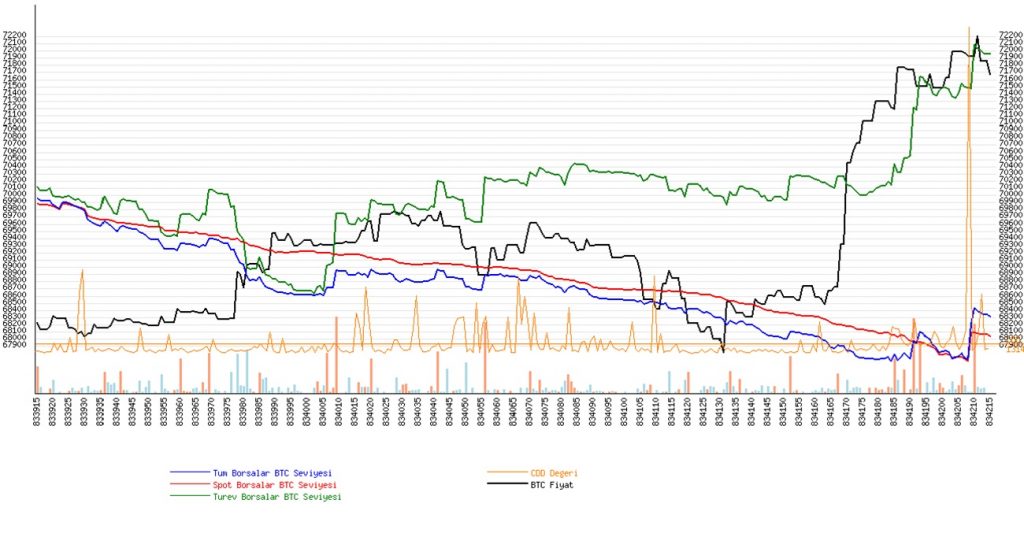
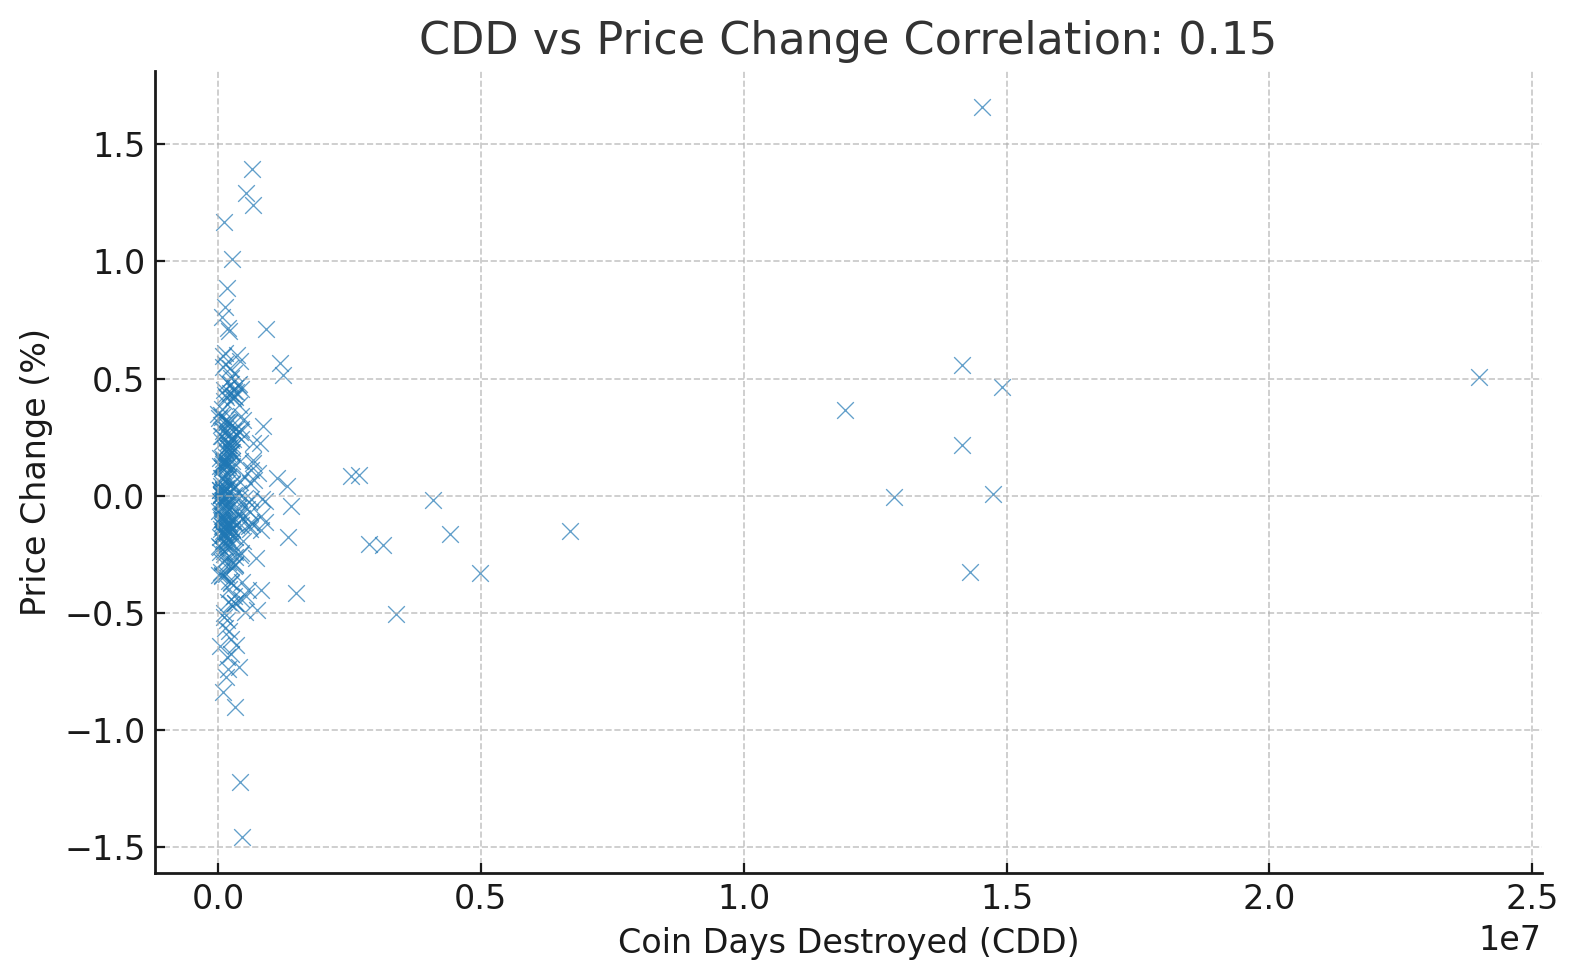
🔹 4. Coin Days Destroyed (CDD)
-
Average Hourly CDD: 833,237
Reflects long-dormant coins being moved — often a precursor to distribution or caution.
🔹 5. Exchange Flows
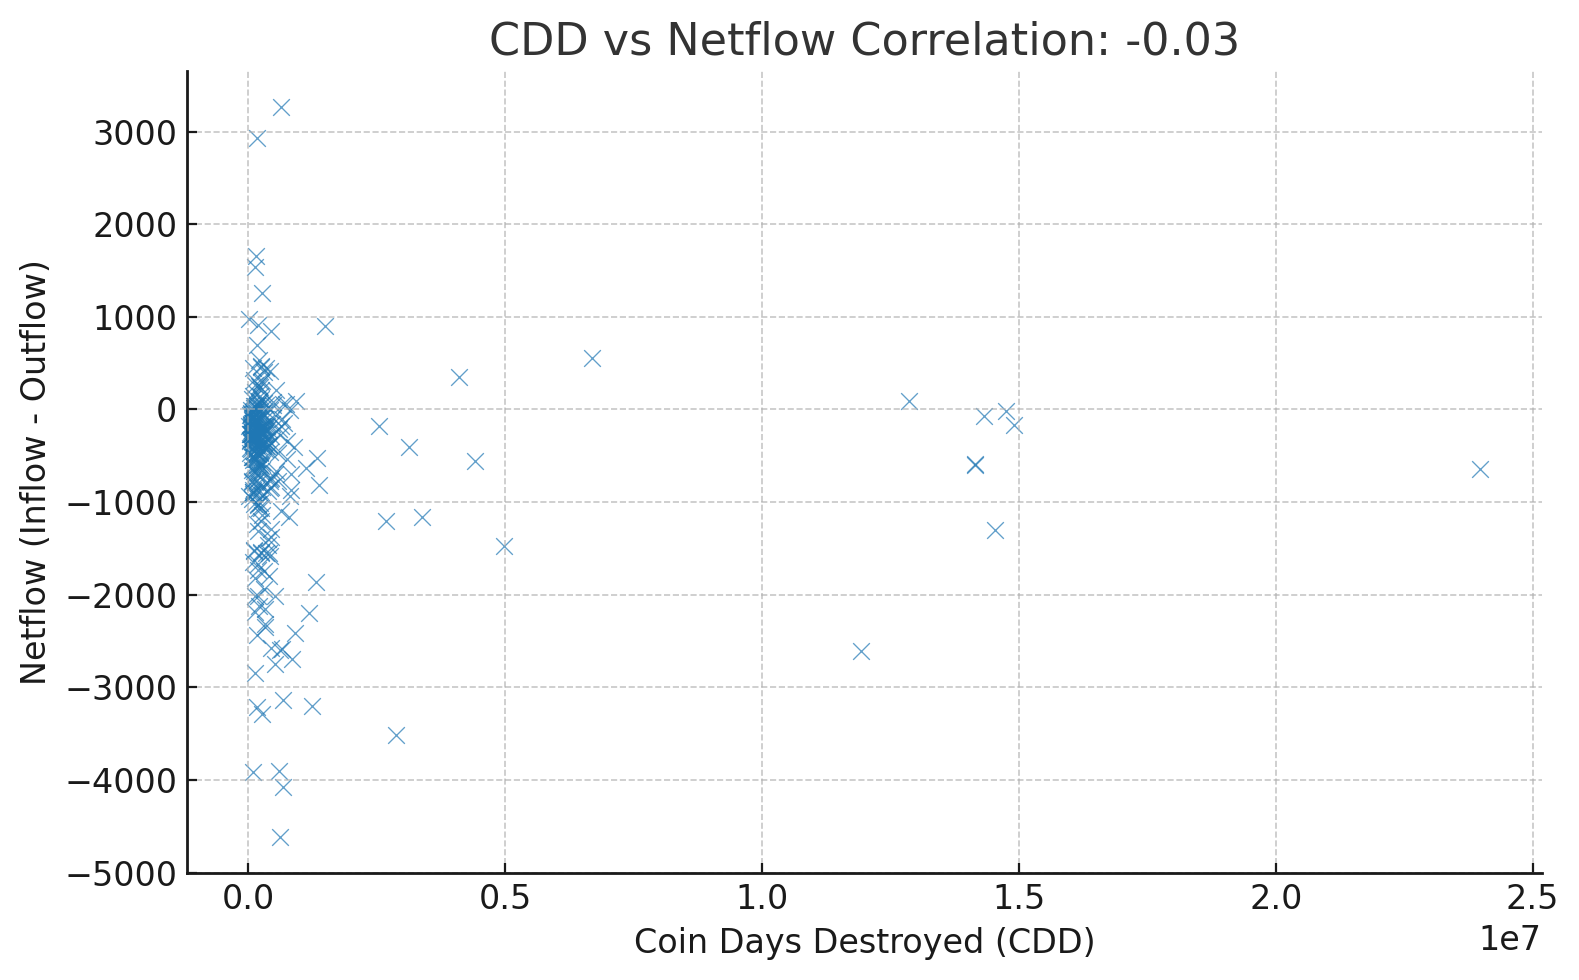
-
Average Inflow < Outflow
-
Netflow Average: -578 POL
Negative netflow suggests more coins leaving exchanges — generally bullish (HODLing behavior).
🔹 6. Volume & Activity
-
Avg Hourly BTC Volume: 833 BTC
-
Avg Trades per Hour: 138,815
High trading activity, strong liquidity.
📉 Visual Summary
Hourly Indicator Averages
🔹 7. Technical & On-Chain Cross Signals
| Indicator | Interpretation |
|---|---|
| STH > Price | Short-term holders in loss → reduced sell pressure |
| STH < Price | STH in profit → risk of realization |
| STH MA (7h/30h) | Momentum tracking |
| STH-Price Deviations | Extreme gaps may signal turning points |
| CDD Spike + Inflow | Possible local top or distribution |
| LTH stable, STH volatile | Long-term holders remain calm, short-term active |
📈 CDD Spike Event Study
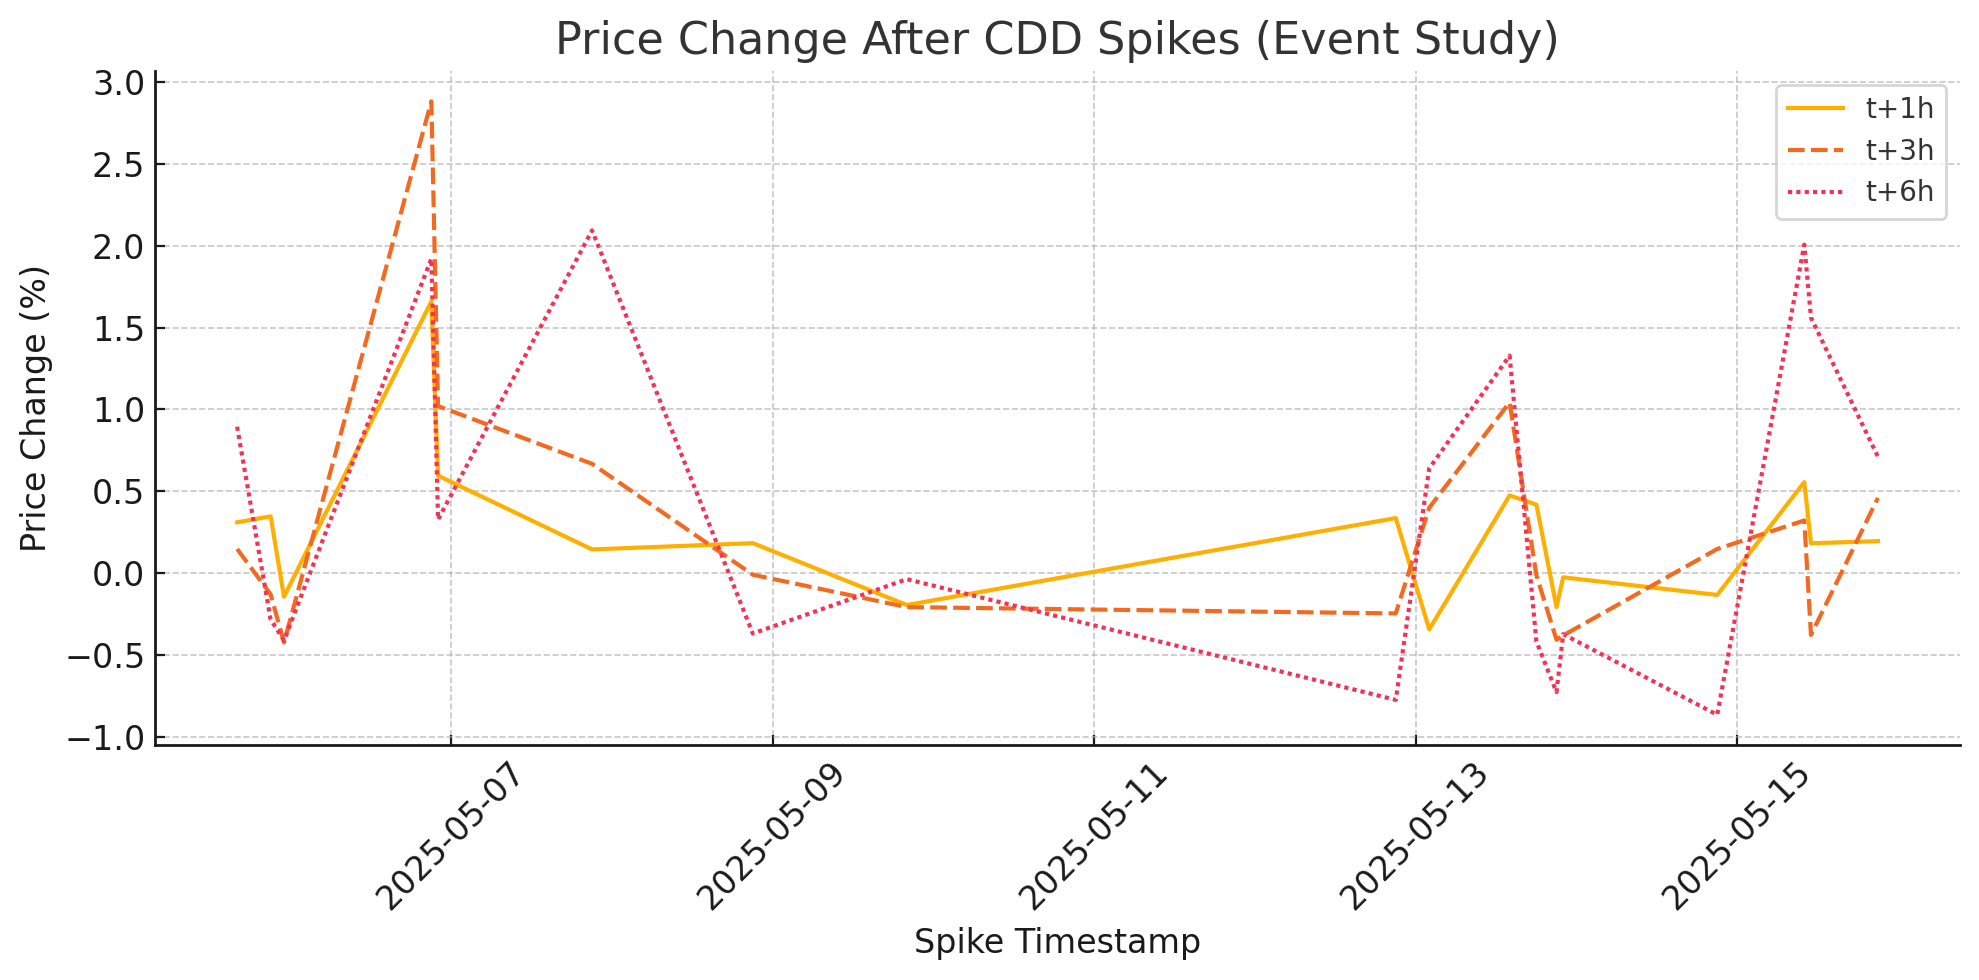
Based on the last 14 days of hourly data, the following chart shows how price responds after a CDD spike (a surge in long-held coin movement):
-
🕐 +1h: slight upward movement
-
⏳ +3h: trend continues
-
🕕 +6h: price mostly remains elevated
This suggests that large coin movements are not immediately followed by sell pressure, and may instead reflect strategic repositioning or speculative demand.