As of May 2025, the Bitcoin market is transitioning through a critical threshold, driven by both on-chain data and technical indicators. The CDDStamp custom analytics suite provides more precise and earlier signals compared to traditional indicators, offering a sharper and more timely outlook. Below is a chart-based breakdown of critical Bitcoin metrics, ordered by relevance.
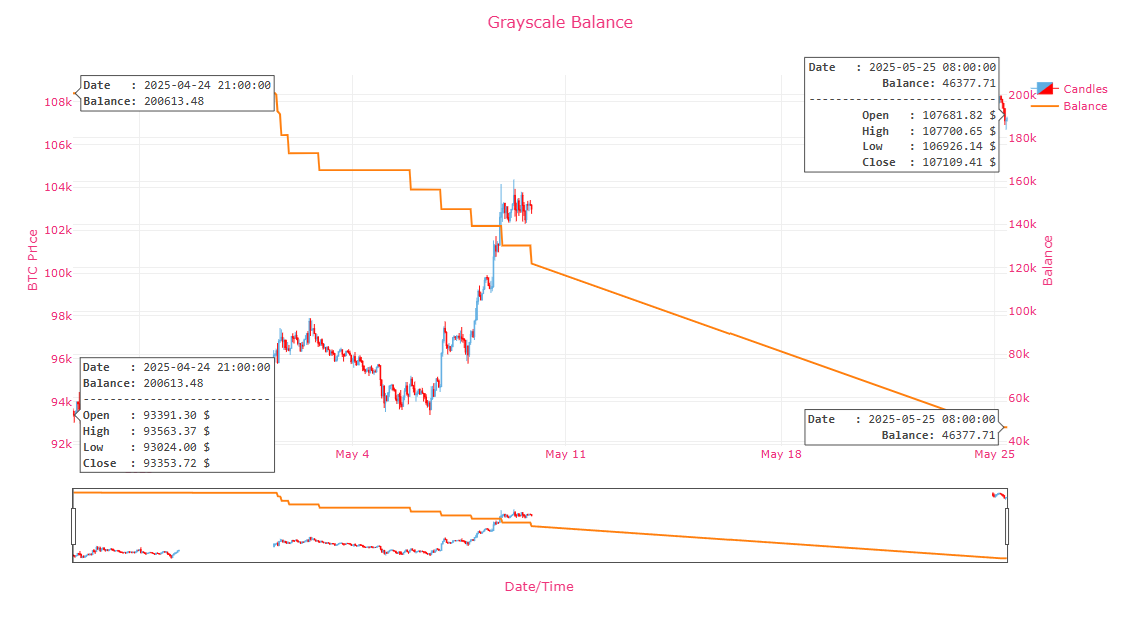
📉 1. Grayscale Balance Monitoring: Institutional Exit Signals
Grayscale’s visible reduction from 200K BTC to 46K BTC strongly suggests institutional liquidity realization. This sharp outflow signals saturation in the upward move. According to CDDStamp’s custom outflow analysis, despite the liquidation, the price remains resilient—indicating high individual investor interest.
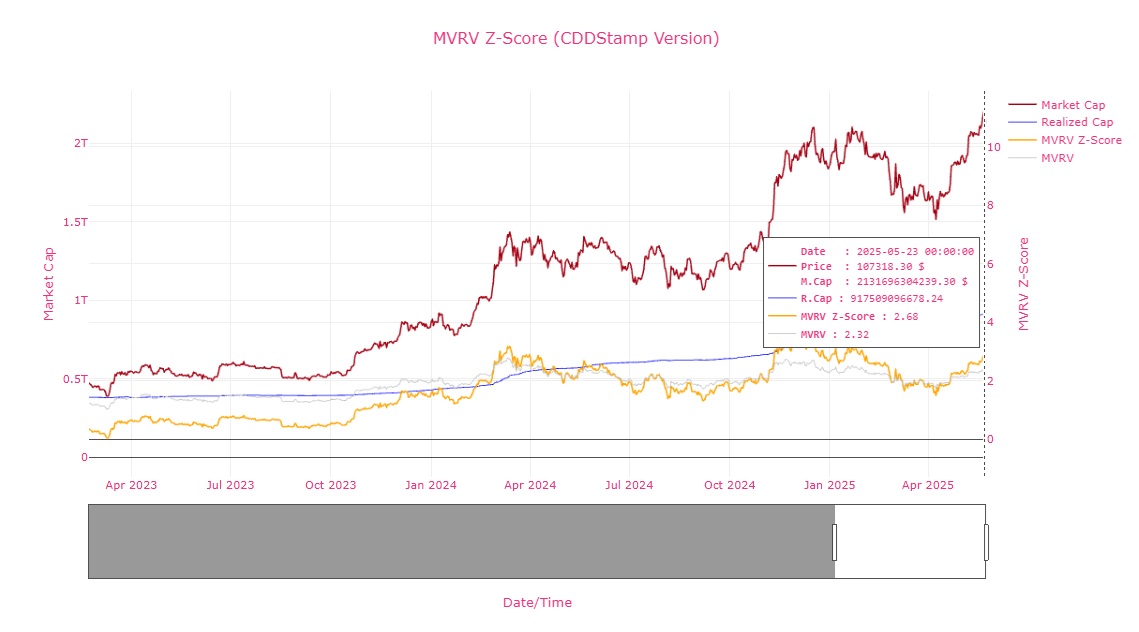
📊 2. MVRV Z-Score (CDDStamp Version): Peak Warning
As of May 23, 2025, the MVRV Z-Score stands at 2.68. Unlike classic calculations, the CDDStamp version uses smoother normalization and custom Realized Cap filtering. With market cap exceeding $2 trillion, the speculative expansion becomes clear. Historically, this level aligns with market tops.
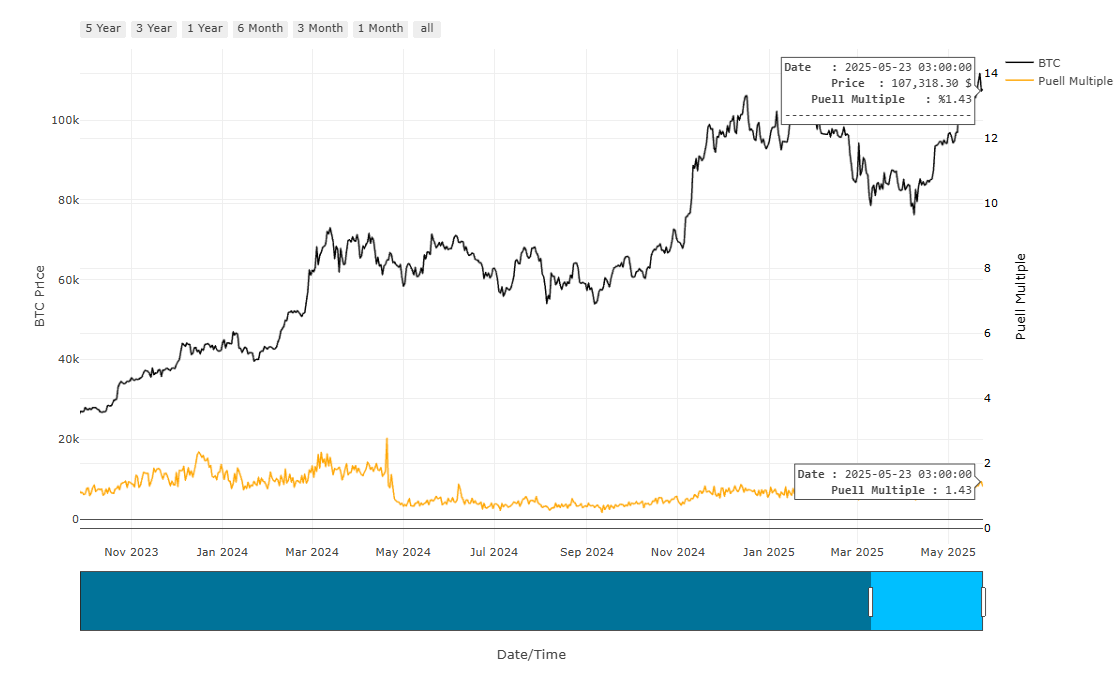
⛏️ 3. Puell Multiple: Miner Profit Realization Near
With a Puell Multiple of 1.43, Bitcoin enters the classic “sell zone” (1.4–2.0). This suggests increasing miner-driven selling pressure could be imminent.
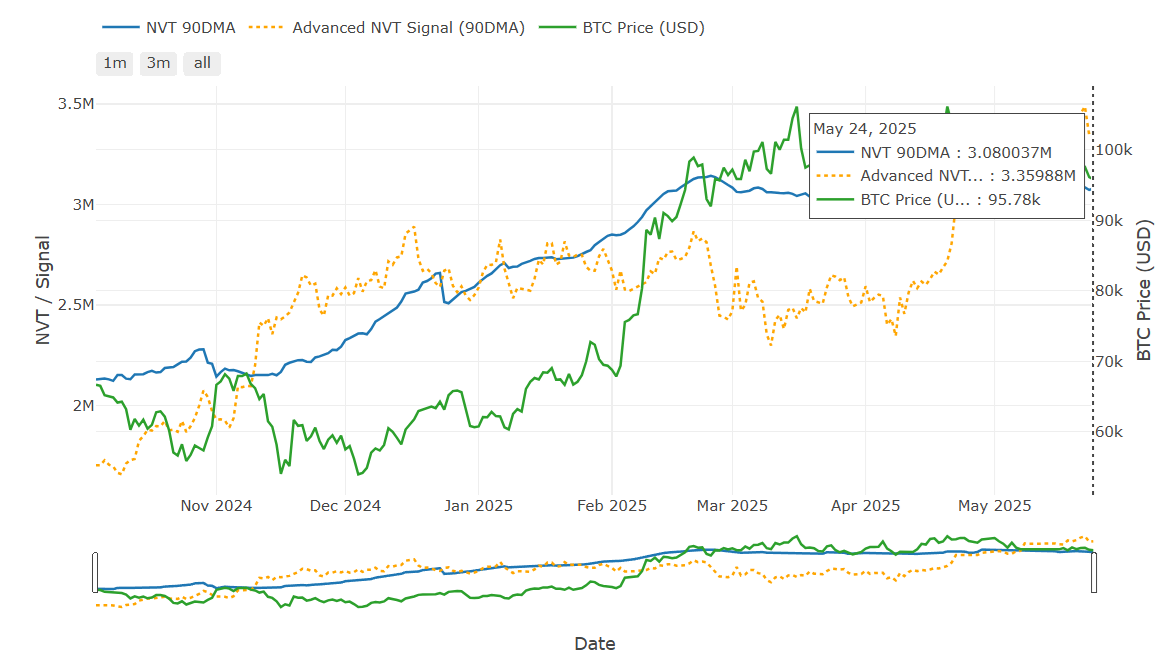
🧠 4. Advanced NVT Signal (CDDStamp): Elevated Valuation
CDDStamp’s 90DMA NVT and Advanced NVT indicators sit at 3.08M and 3.35M, respectively—both extremely high. These levels indicate price has outpaced the network’s transactional value. Historically, this gap tends to close—either through price correction or volume increase.
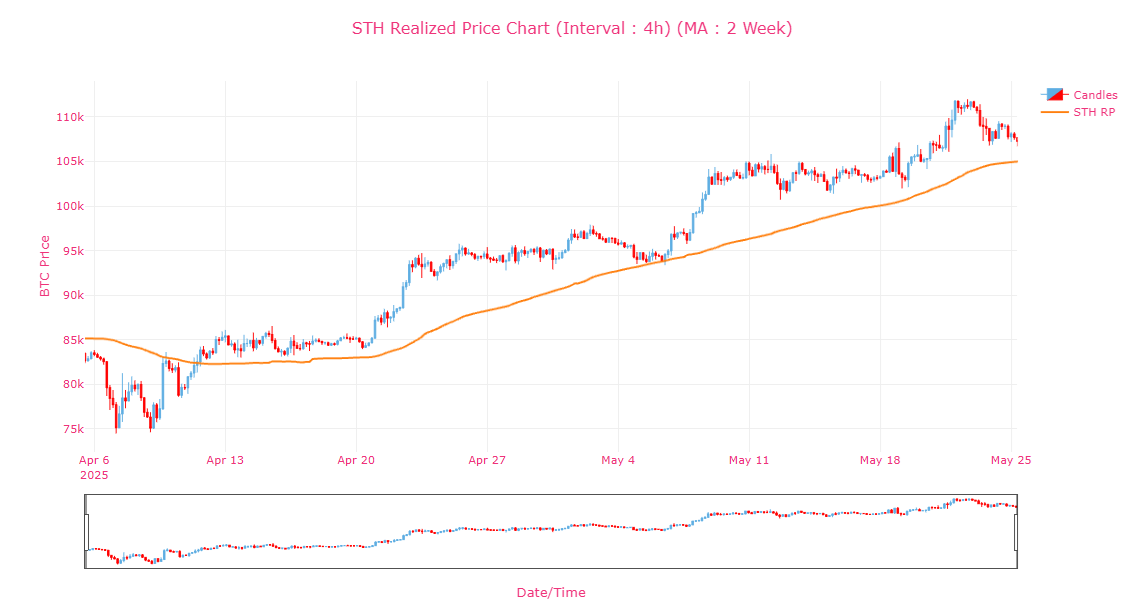
🧾 5. STH Realized Price (1D & 4H): Price Holding Above Short-Term Holder Cost Basis
Price remains above the STH realized price, confirming there’s no panic selling and showing continued resilience. However, short-term consolidation in the 4H chart hints that if breakdown occurs, initial pressure will likely come from this segment.
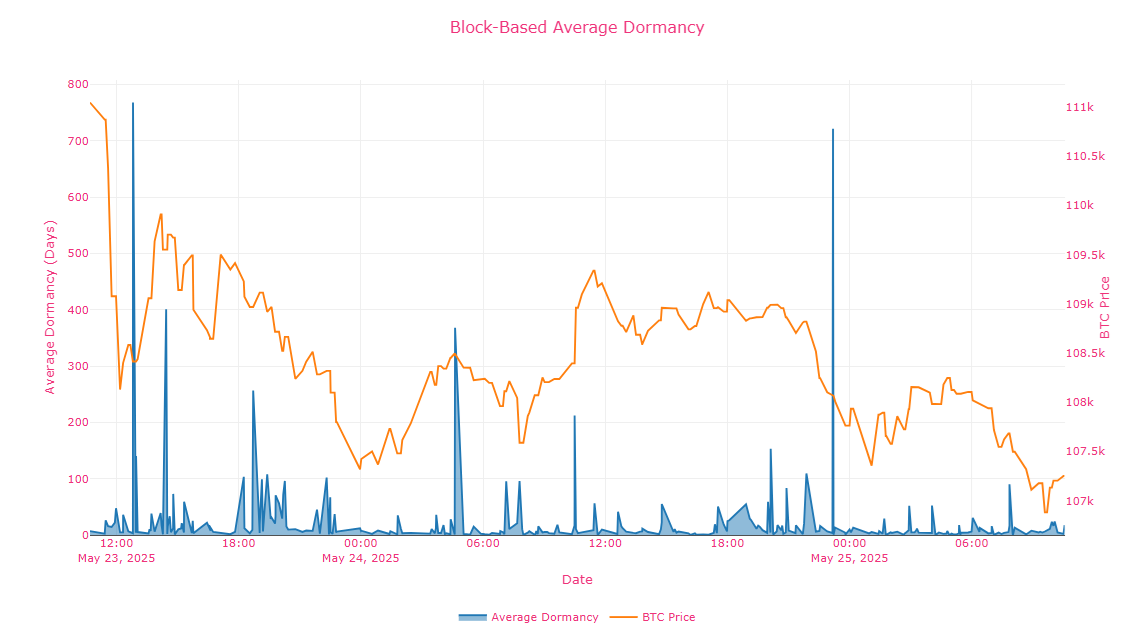
🕰️ 6. Dormancy Flow & Block-Based Dormancy: Old Coins on the Move
CDDStamp indicators show dormancy flow approaching historical averages. This signals that long-dormant coins are re-entering circulation—likely from older holders realizing profits.
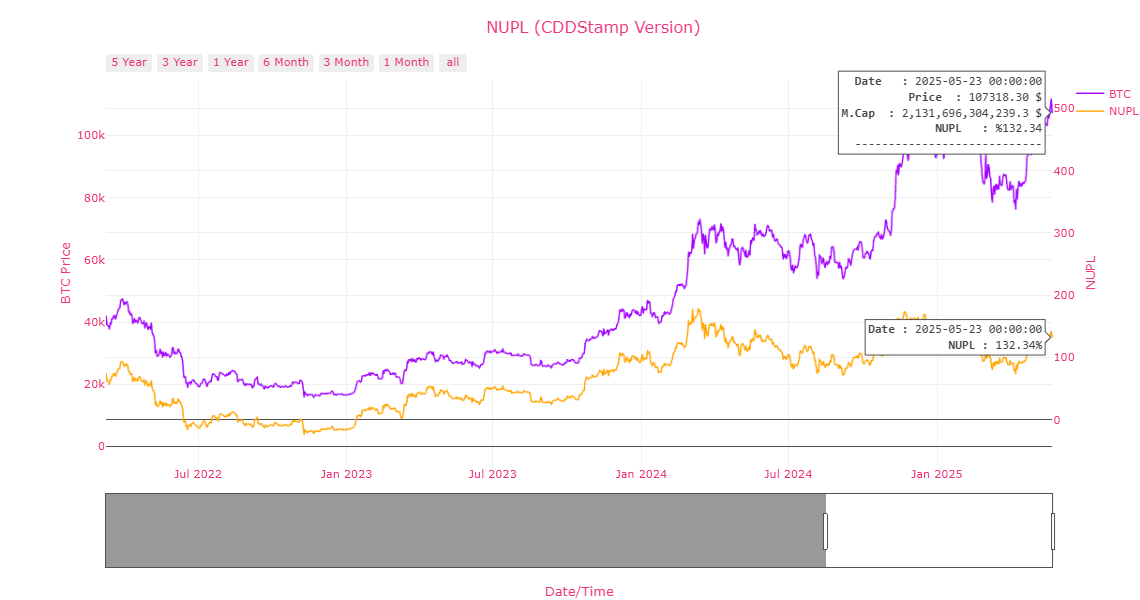
💰 7. NUPL (CDDStamp): Entering Profit-Taking Zone
CDDStamp’s Net Unrealized Profit/Loss indicator shows market participants are still mostly in profit, but the metric is nearing its peak. This implies entry into the “distribution” phase of the cycle.
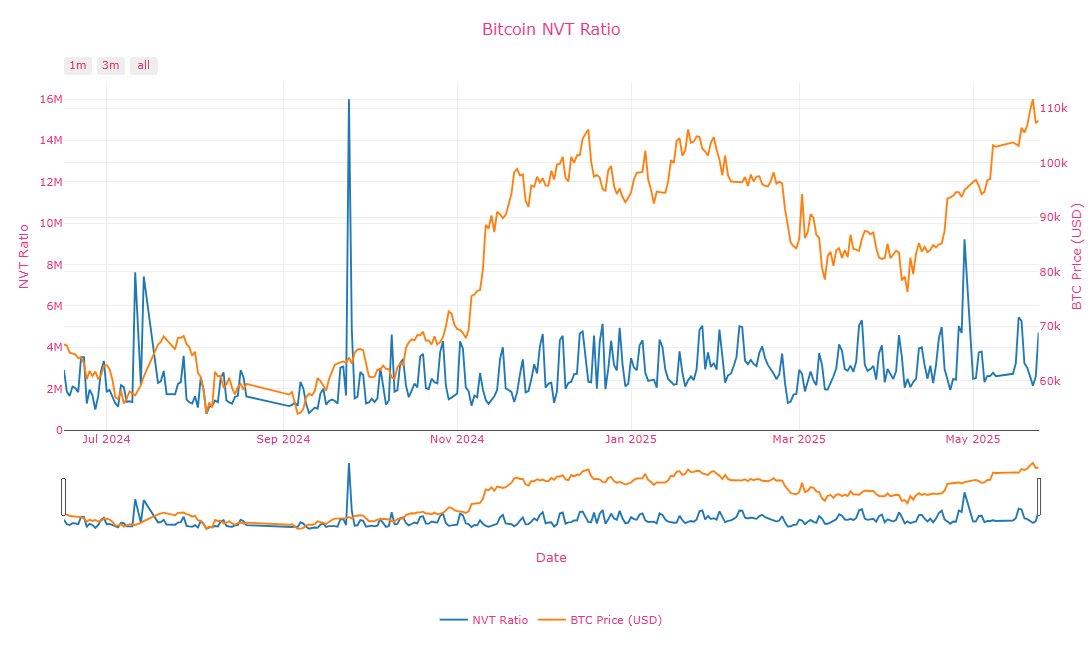
🧮 8. NVT Ratio & Signal: Overvaluation Risk
Both traditional NVT Ratio and CDDStamp’s Advanced NVT signal show extreme upper-bound levels. These zones historically lead to either consolidation or price corrections.
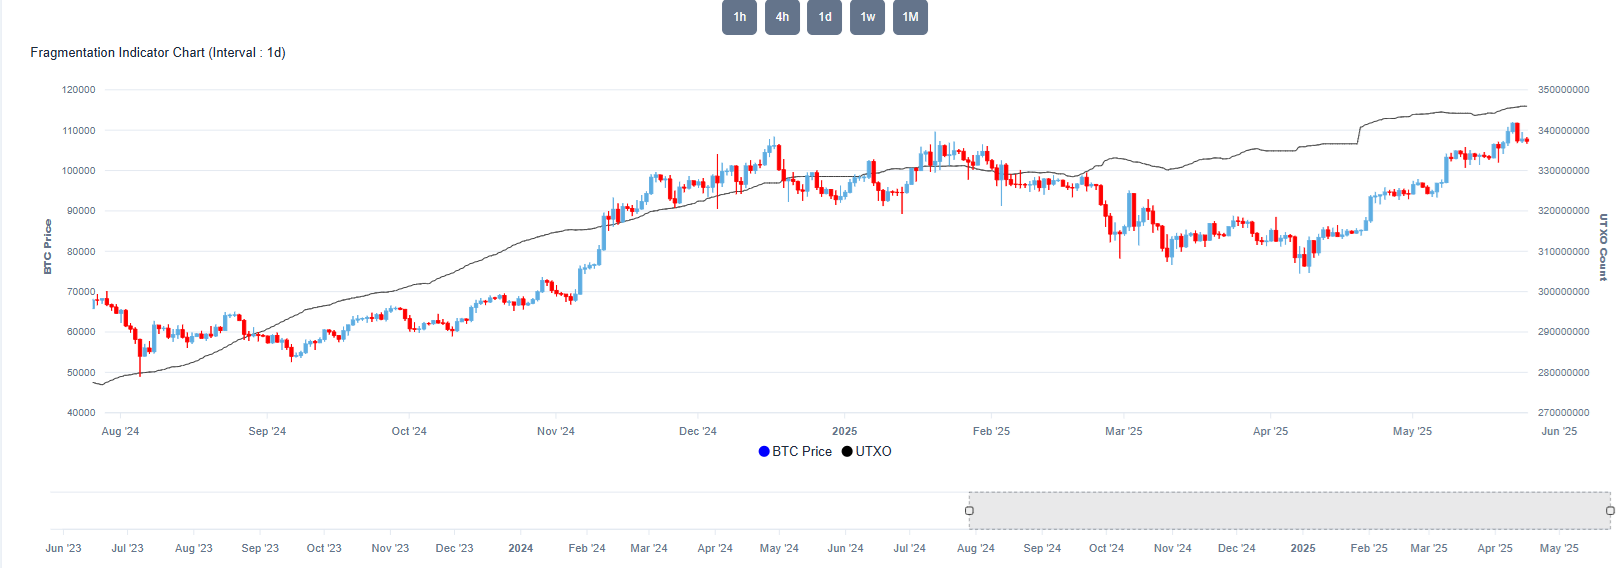
🧬 9. Fragmentation Indicator (UTXO Count): On-Chain Activity High but Congested
UTXO count continues to rise while price shows lateral movement. This divergence suggests increased on-chain activity that hasn’t yet translated into price momentum.
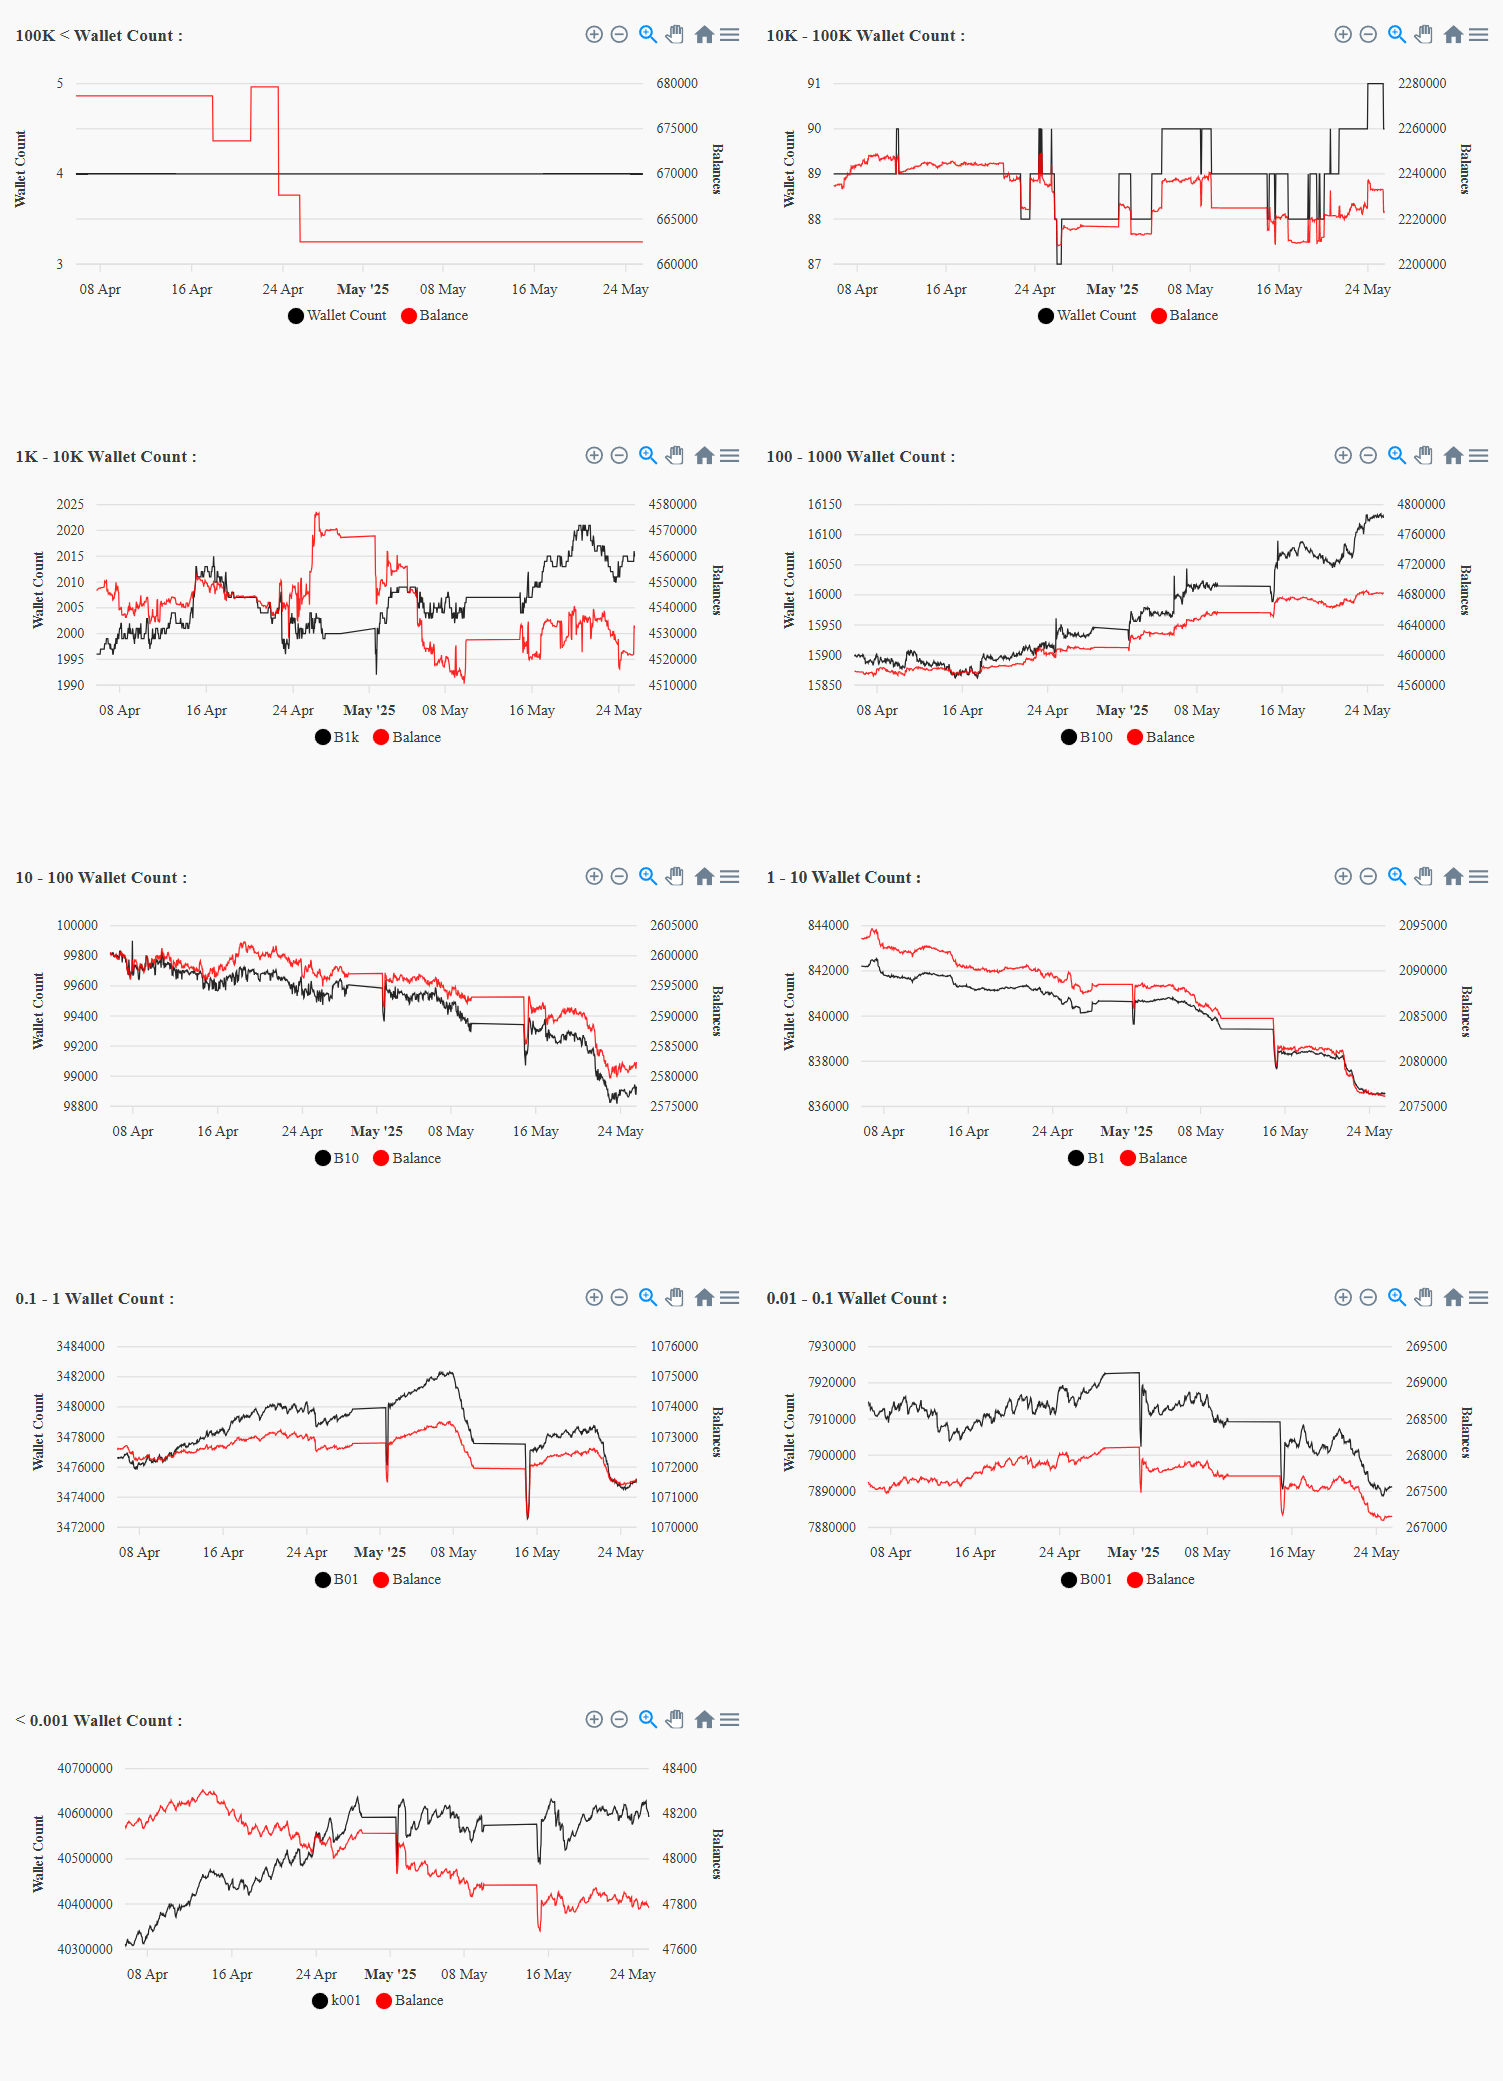
🐋 10. Wallet Segment Distribution: Whales Selling, Mid-Tier Accumulating
Decline in wallets holding >10K BTC alongside an increase in 100–1000 BTC and 0.1–1 BTC wallet segments indicates redistribution. Mid-sized holders and retail investors are accumulating as whales offload.
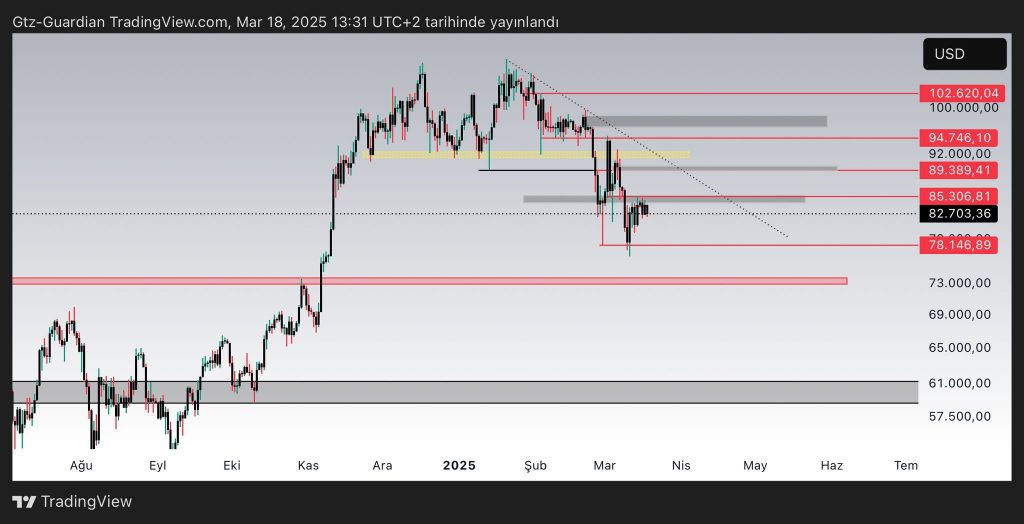
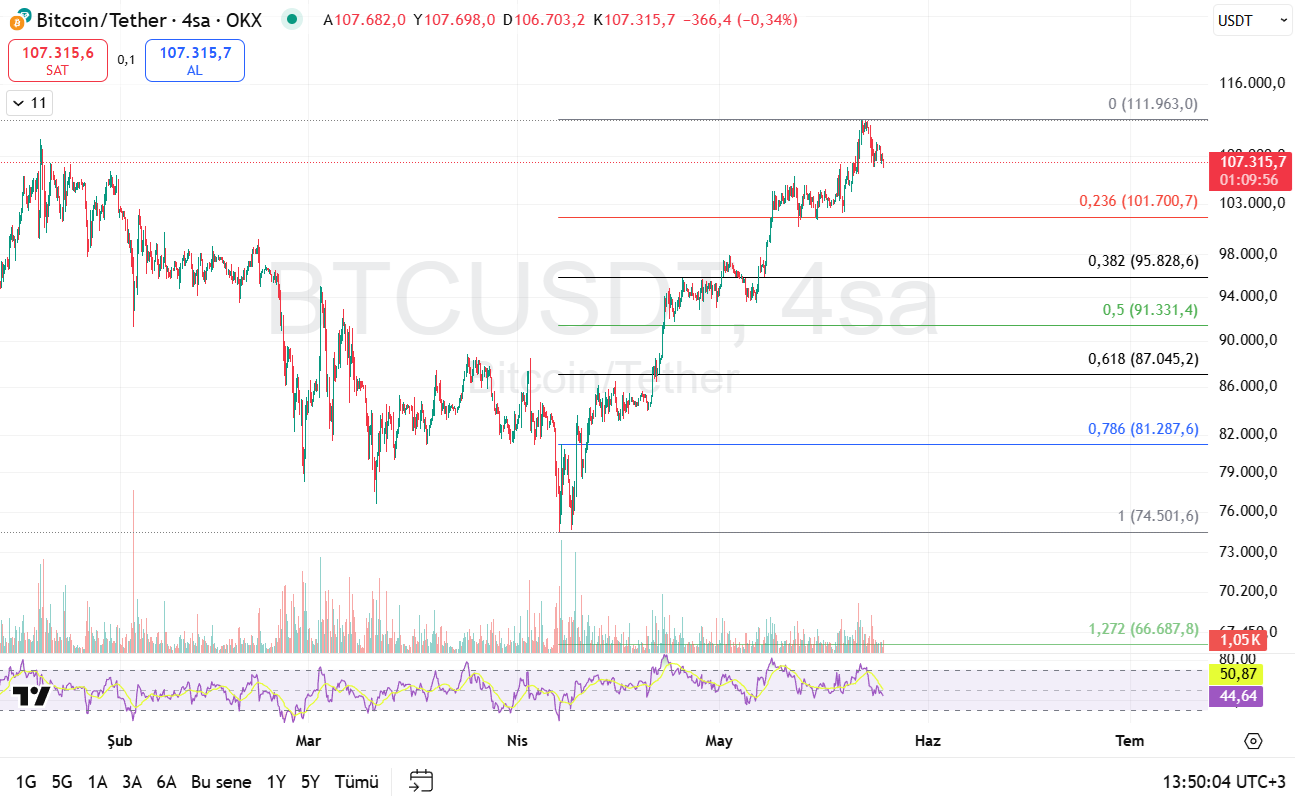
📐 11. BTCUSDT (4H – Fibonacci Tracking): Technical Correction Risk
After peaking at 111,963 USDT, price shows a risk of retracing to the 0.236 Fibonacci level (~101,700 USDT). RSI is flashing bearish divergence.
🔍 In-Depth Interpretation Before the Conclusion
The intersection of MVRV, NUPL, and Advanced NVT suggests that market participants are sitting on notable unrealized profits, and transactional value is lagging behind valuation. When these three rise together, historically it marks a euphoric top.
Meanwhile, miner behavior (Puell) and dormancy spikes hint that long-term holders are distributing coins to newer participants—fitting the late-phase of a bull run cycle. Grayscale’s balance outflows confirm that institutional players are already exiting, handing off liquidity to retail buyers, as reflected in the wallet distribution shifts.
Notably, although the technical price structure remains intact (price above STH RP), the combination of excessive network valuation, miner selling potential, and long-term coin movements necessitate caution.
✅ CONCLUSION
This advanced analysis—powered by CDDStamp indicators—goes beyond standard metrics to signal a high-valuation, potential profit-taking phase. Technicals are aligned with on-chain metrics, suggesting a slowdown or consolidation is likely. While the long-term outlook remains bullish, caution is warranted in the short term.