Technical analysis of structures outside classical harmonic formations
Summary
In financial markets, harmonic patterns (Gartley, Bat, Crab, Butterfly, etc.) are strictly tied to specific Fibonacci ratios. However, a significant portion of the structures observed in practice do not fully meet these ratios. Despite this, they carry a geometric symmetry and extension character similar to harmonics.
This study conceptually examines these structures—which have no official name in the literature yet are encountered constantly in analytical practice—under the title “Non-ideal / Harmonic-like structure.” The aim is to present, within a technical framework, what these structures are, what they are not, how they should be read, and which mistakes should be avoided.
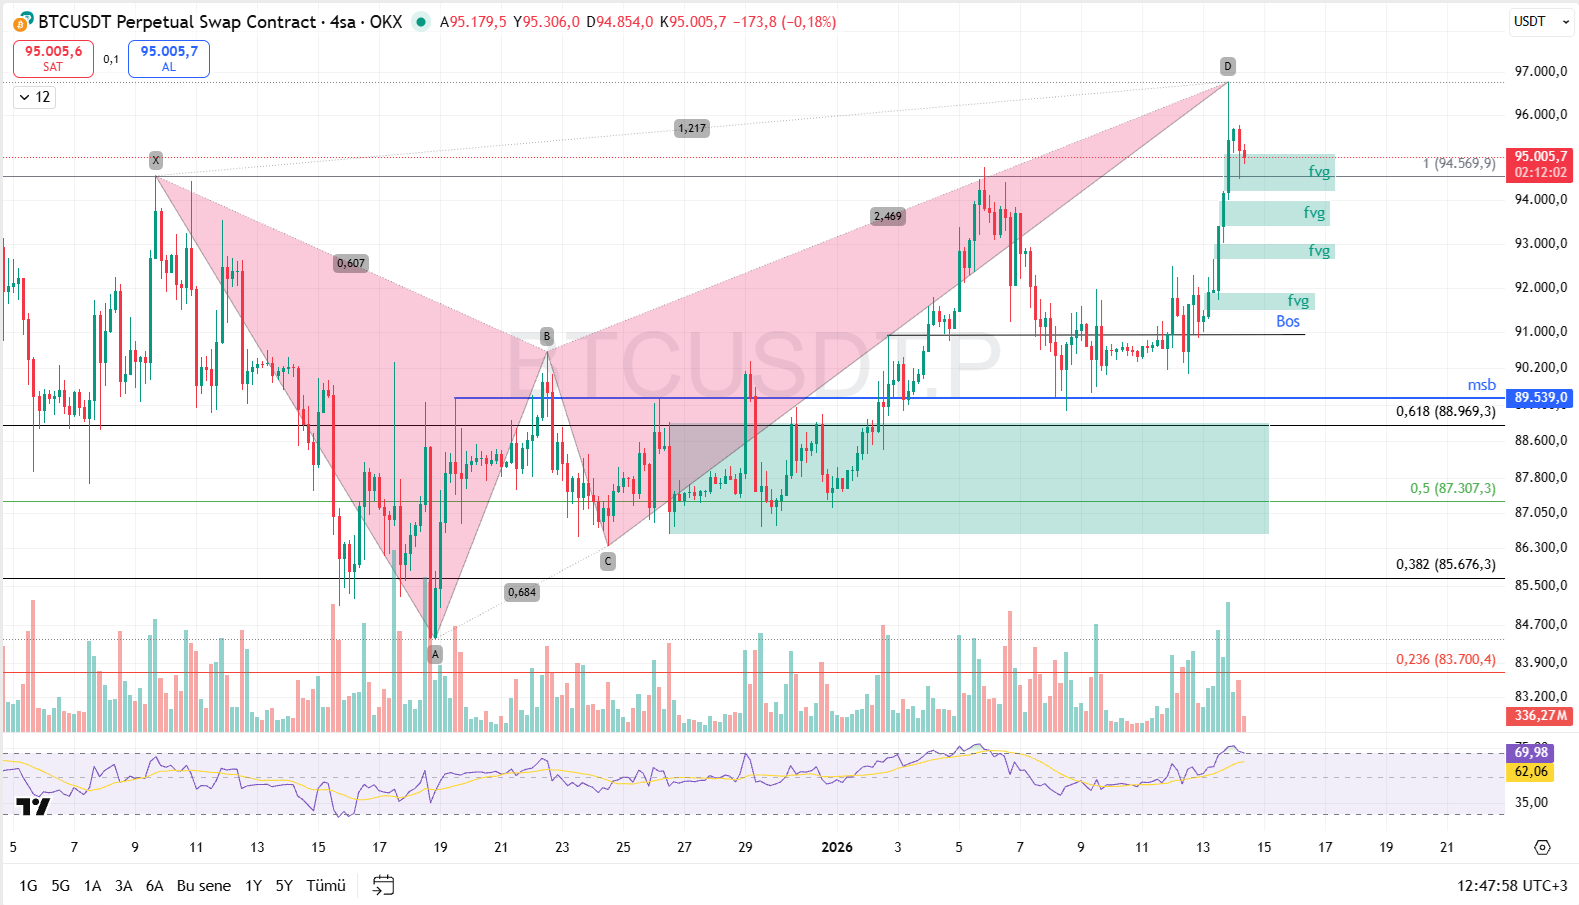
In the sample pattern, apart from the XD Fibonacci values, all other ratios are the same as those of the CRAB formation. It has ratios that have been extensively backtested.
1. The boundary of classical harmonic formations
In harmonic analysis, for a structure to be called a formation:
- The XAB, ABC, BCD, and XAD ratios must fall within specific Fibonacci ranges.
- If even one of these ratios deviates significantly, the structure technically does not belong to that formation class.
For example:
- Crab → XAD ≈ 1.618
- Bat → XAD ≈ 0.886
- Gartley → XAD ≈ 0.786
- Butterfly → XAD ≥ 1.27
These ratios are the identity of the formation. If there is no ratio, there is no formation.
2. Market reality: the rarity of ideal structures
Real market behavior is not as clean as textbook examples:
- The D point often misses the targeted Fibonacci level by a few percent.
- The CD leg either overextends or ends early.
- While AB or BC ratios may remain within range, XAD can be completely outside.
As a result, the following types of structures emerge:
- There is geometrically an XABCD sequence.
- There is a sense of symmetry.
- The CD extension looks “harmonic.”
- Yet the ratio set does not fully satisfy any classical template.
Technically, these structures are not formations. However, they cannot be ignored.
3. What is a Non-ideal / Harmonic-like structure?
This expression is not an official formation name.
It is a classification concept.
It has the following characteristics:
- XABCD geometry exists.
- At least 2–3 ratios are close to harmonic ranges.
- The most critical ratio (most often XAD) is incompatible.
- The CD leg generally exhibits an extension character.
- Liquidity cleansing and algorithmic symmetry effects are observed in the market.
By definition:
Price structures that resemble harmonic formations but do not fully satisfy the mathematical ratios of any classical template.
4. Why do they have no names in the literature?
Because the discipline of harmonic analysis is built on sharp classification:
- Either it is a formation
- Or it is not
No standard terminology has been developed for the intermediate zone. Academic publications and classical sources deliberately avoid naming gray areas.
The reasons are:
- Increasing the risk of subjective interpretation
- Creating ambiguity in automated systems
- Weak statistical testability
Therefore, such structures are usually referred to as:
- “distorted pattern”
- “incomplete harmonic”
- “failed harmonic attempt”
- “extended ABCD-type move”
5. How should they be handled analytically?
Such structures are not suitable for producing rule-based trade signals like classical harmonics.
However, they are valuable in the following respects:
a) Liquidity map
The CD extension often reaches:
- Stop clusters
- Previous low/high concentrations
- Volatility pockets
b) Risk zone identification
Even if the XAD ratio does not fit:
- Areas where CD is excessively extended
- Form short-term saturation zones
This implies not a reversal, but reaction potential.
c) Use together with a trend filter
They are not signals on their own.
But when used together with:
- Order block
- Market structure
- HTF support/resistance
- Liquidity sweep
they produce high-quality contextual information.
6. Most common mistakes
- Assuming harmonic appearance guarantees a reversal
- Using CD extension alone as a trade reason
These are behaviors that systematically produce losses.
7. Practical classification proposal
In analytical practice, it is healthy to divide structures into three groups:
- Ideal harmonic structure
→ Classical formation, ratios fully aligned - Borderline harmonic structure
→ Minor tolerance deviations - Non-ideal / harmonic-like structure
→ Geometry exists, ratio identity does not
The third group is the subject of this article.
Conclusion
Non-ideal / harmonic-like structure:
- Is not one of the defined (classical) harmonic formations.
- Is not a signal on its own.
- Is not a “name,” but a state description.
When used correctly, it can indicate:
- Where the market is excessively extended
- Where liquidity cleansing is taking place
- Short-term risk concentration
When used incorrectly, it produces:
- Confusion with defined formations
- Early trades
- Artificial confidence
Making this distinction in professional analysis is the fundamental difference that makes harmonic tools truly effective.
Note: This study was prepared to technically position structures that are frequently encountered in market practice but remain unnamed in the literature, while preserving the classical harmonic analysis framework.