What Are Bitcoin’s On-Chain Signals Really Telling Us?
Fragmentation, Distribution, and a Market Losing Strength
Price alone doesn’t tell the full story in crypto. The real picture comes from combining on-chain data, investor behavior, and market structure. Right now, those layers are pointing in the same direction-and it’s not a strong one.
1. The Trend Regime: Price Below STH
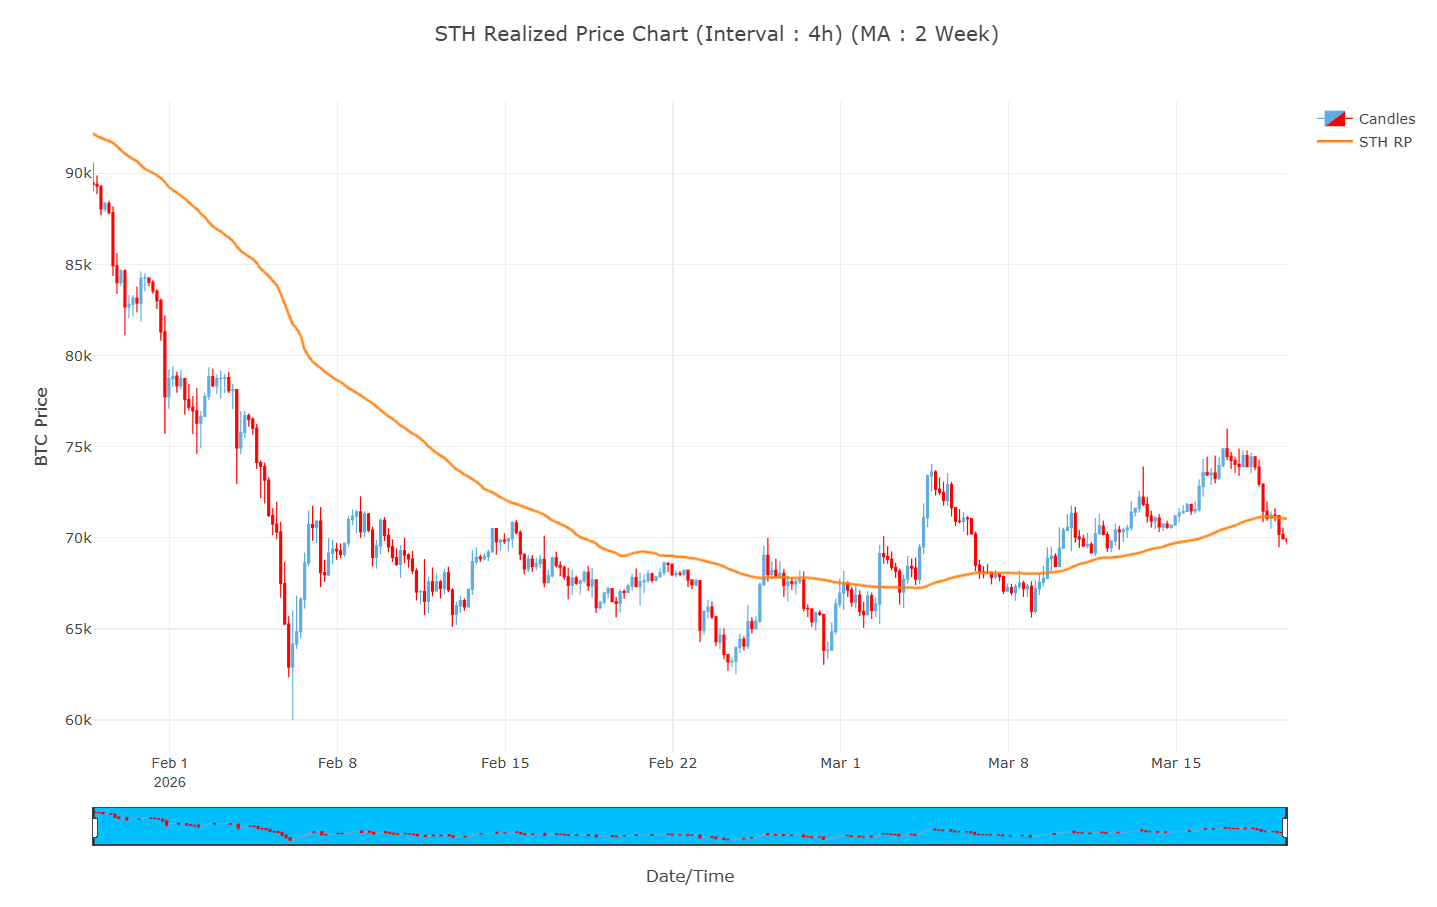
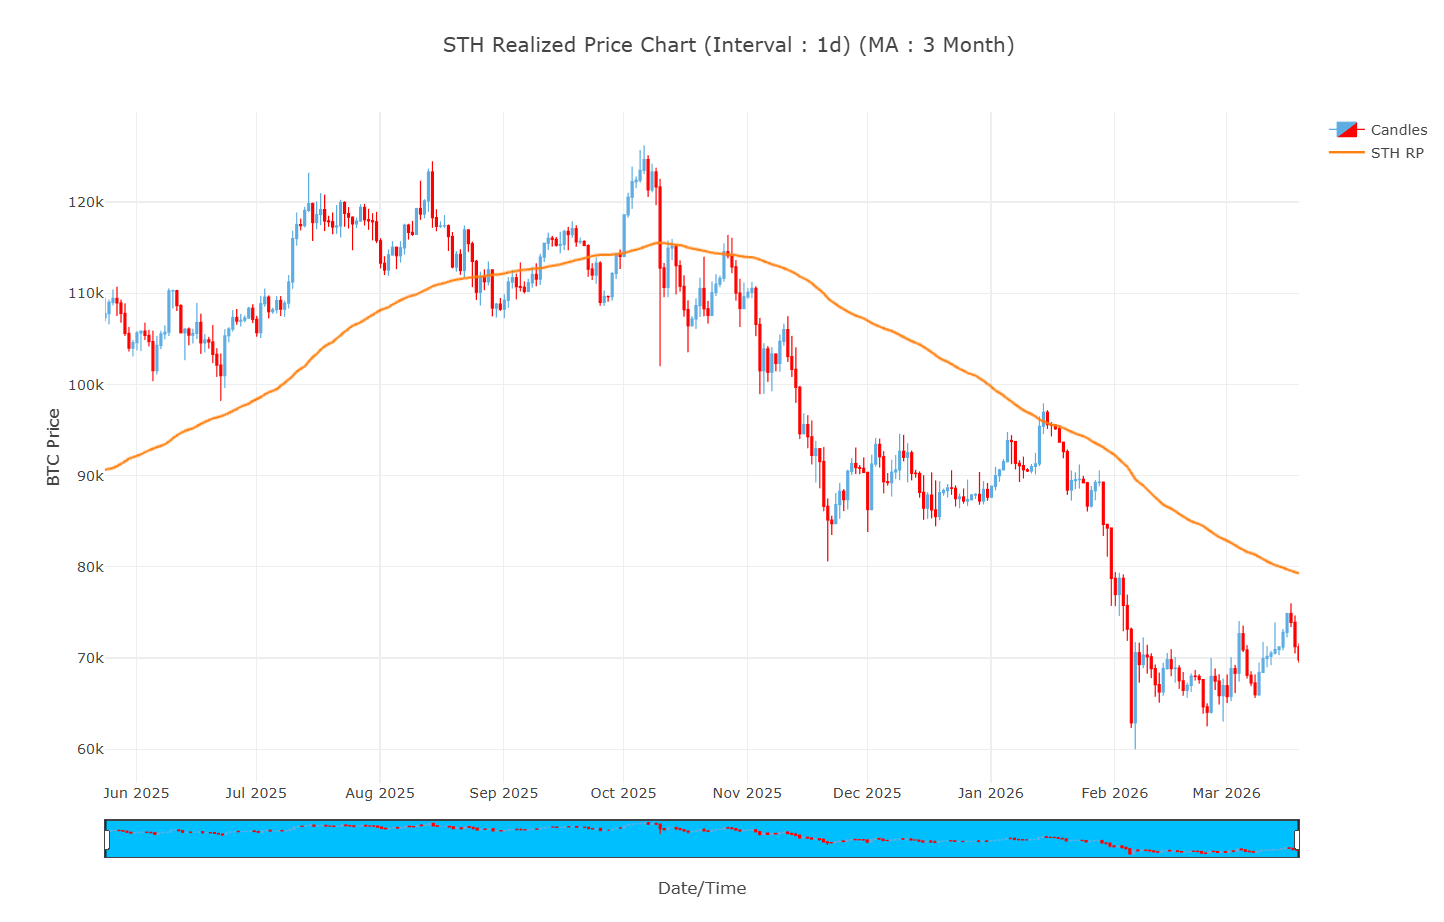
The Short-Term Holder (STH) realized price reflects the average cost basis of recent buyers. It’s one of the clearest ways to understand whether the market is in a risk-on or risk-off phase.
At the moment:
-
Bitcoin is trading below the STH level
-
The STH trend itself is sloping downward
That combination is important. It typically means:
The market has shifted into a risk-off regime.
In this environment, upward moves tend to be temporary. They’re often relief rallies or short squeezes—not the start of a sustained uptrend.
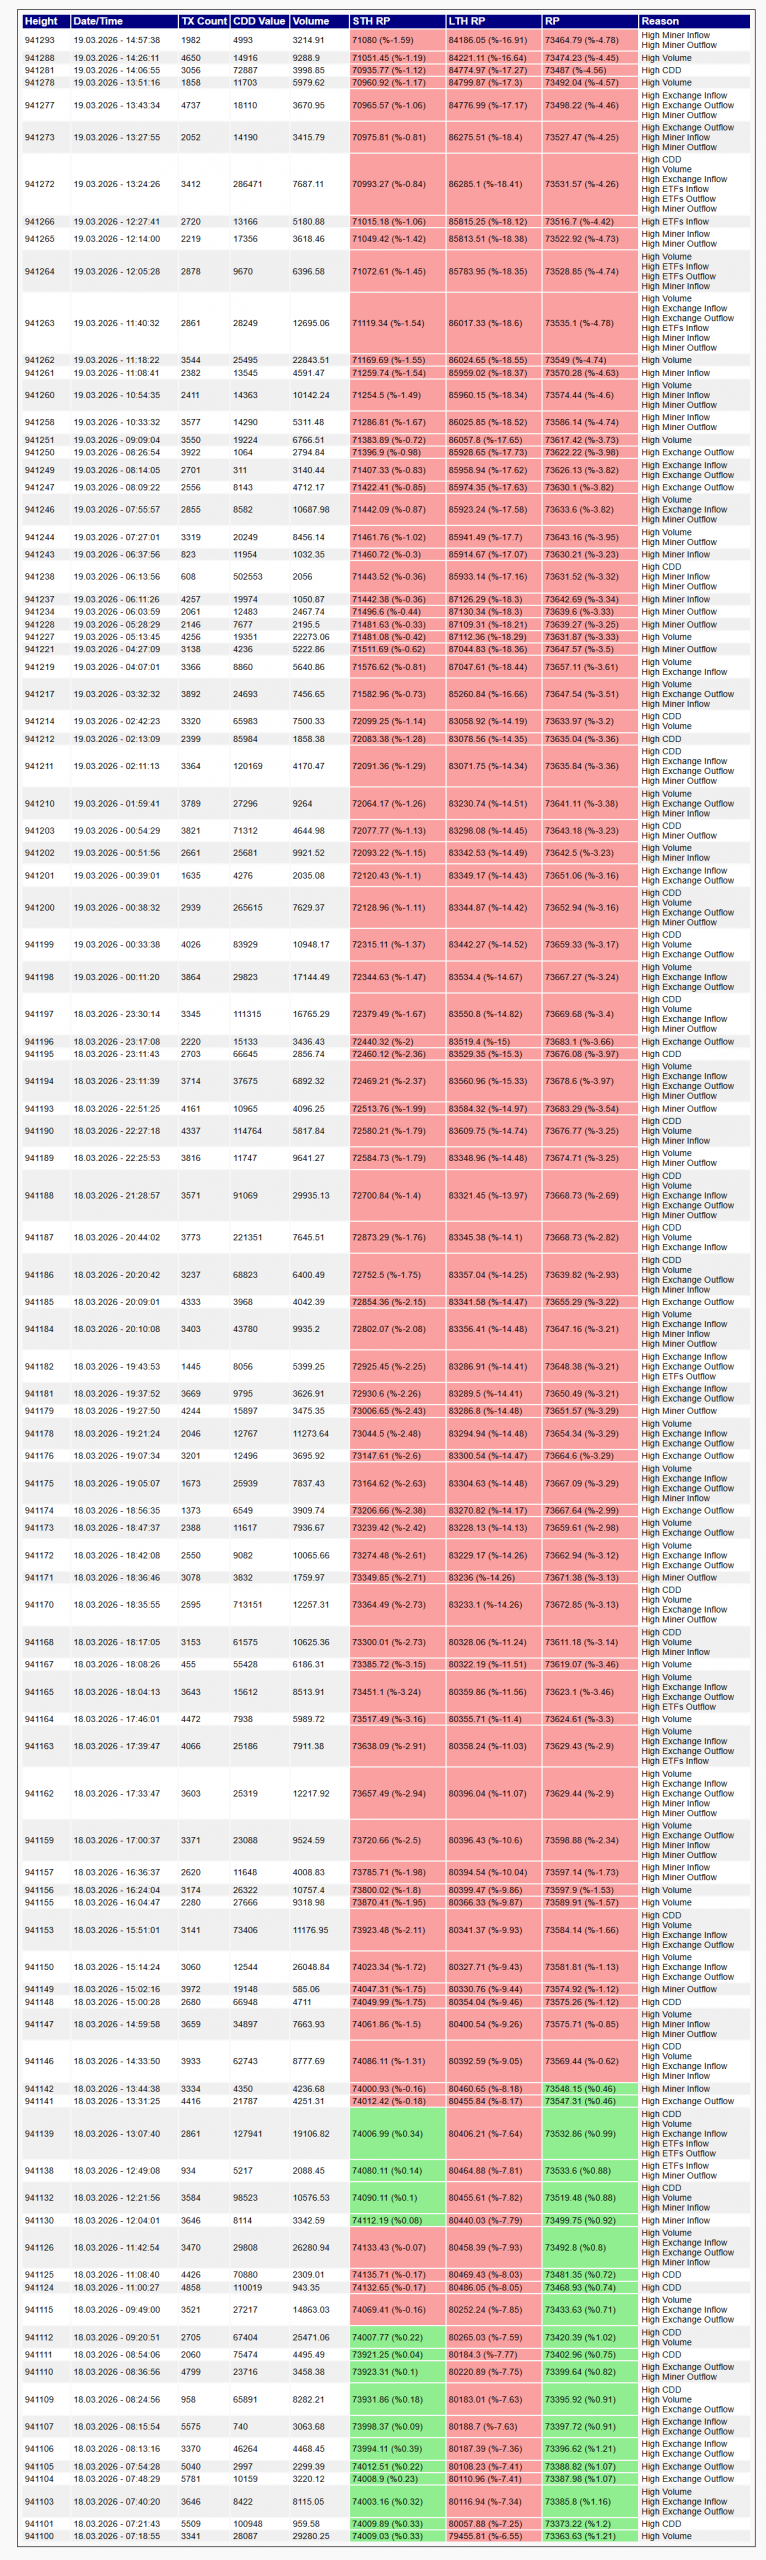
2. Rising UTXO Count: Growth or Fragmentation?
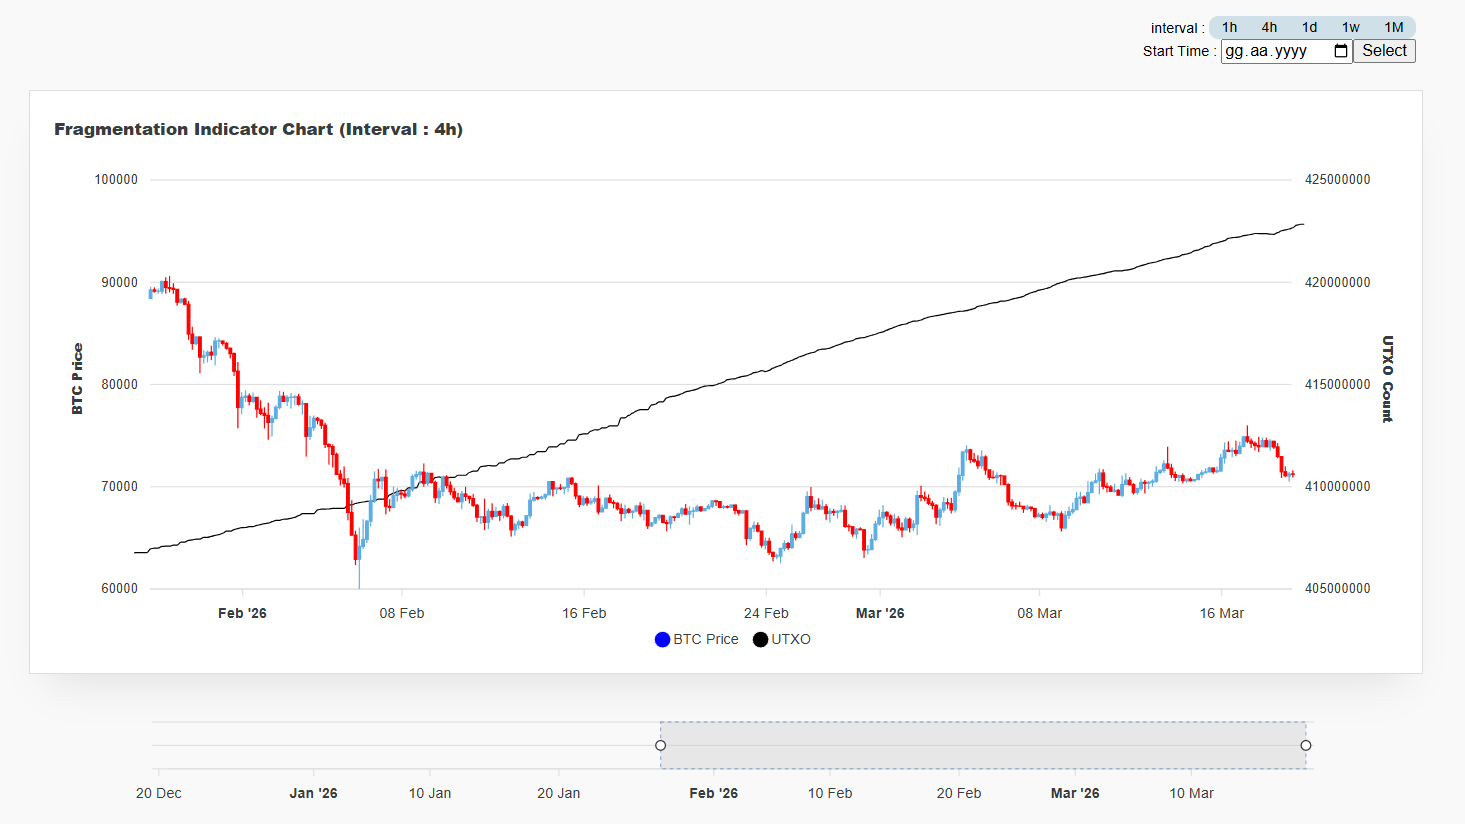
An increase in UTXO count usually means Bitcoin is being split into smaller pieces and distributed across more wallets. In a healthy bull phase, this often happens alongside rising prices.
But that’s not what we’re seeing now.
-
UTXO count is rising
-
Price is falling
This mismatch matters. It suggests:
-
Larger holders are reducing exposure
-
Coins are being redistributed to smaller participants
In simple terms:
This isn’t accumulation. It’s post-distribution fragmentation.
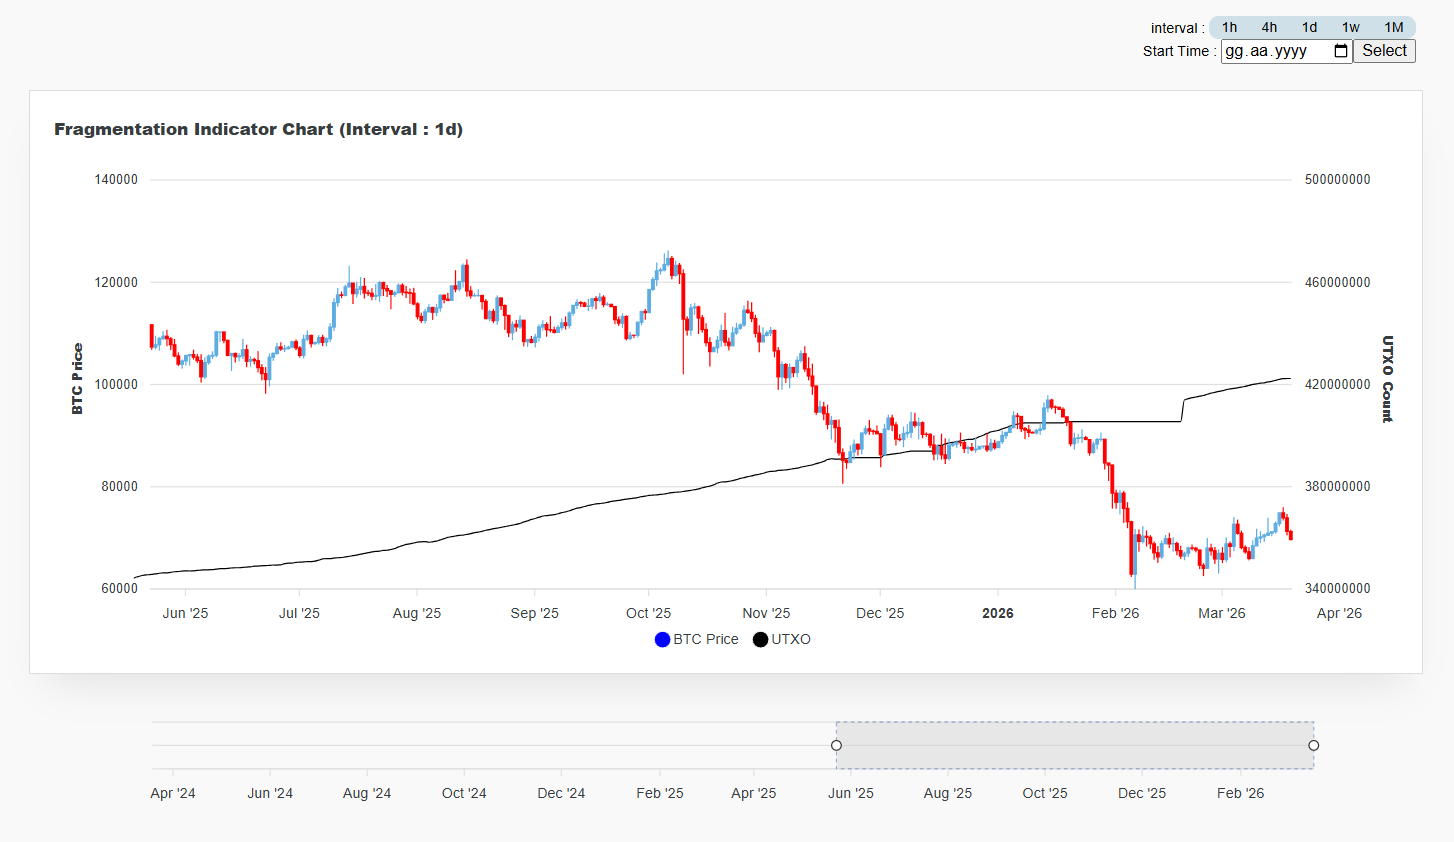
3. Wallet Distribution: Who’s Buying and Who’s Selling?
Breaking down wallet behavior gives a clearer view of what’s really happening beneath the surface.
Large Holders (Smart Money)
-
10K–100K BTC: flat to slightly declining
-
1K–10K BTC: declining
→ Large players are scaling out
Mid-Tier Wallets
-
100–1000 BTC: increasing
→ Transitional phase
Smaller Wallets (Retail)
-
0.1–1 BTC and below: clearly increasing
→ Retail is stepping in
Put together, this paints a familiar picture:
The market is in a distribution phase.
4. Valuation Metrics: Not Cheap, Not Expensive
On-chain valuation tools help answer a key question: where are we in the cycle?
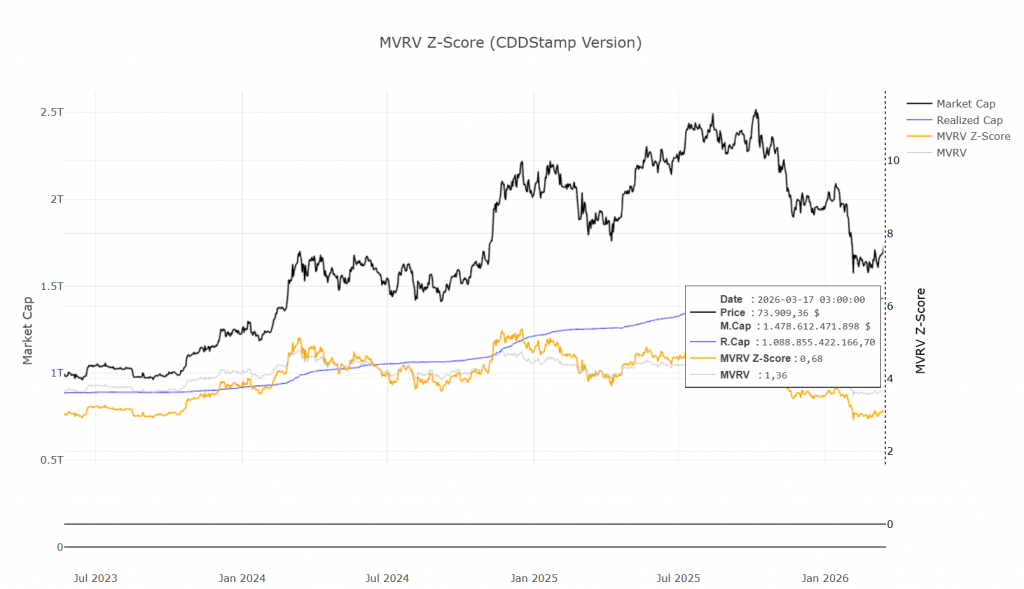
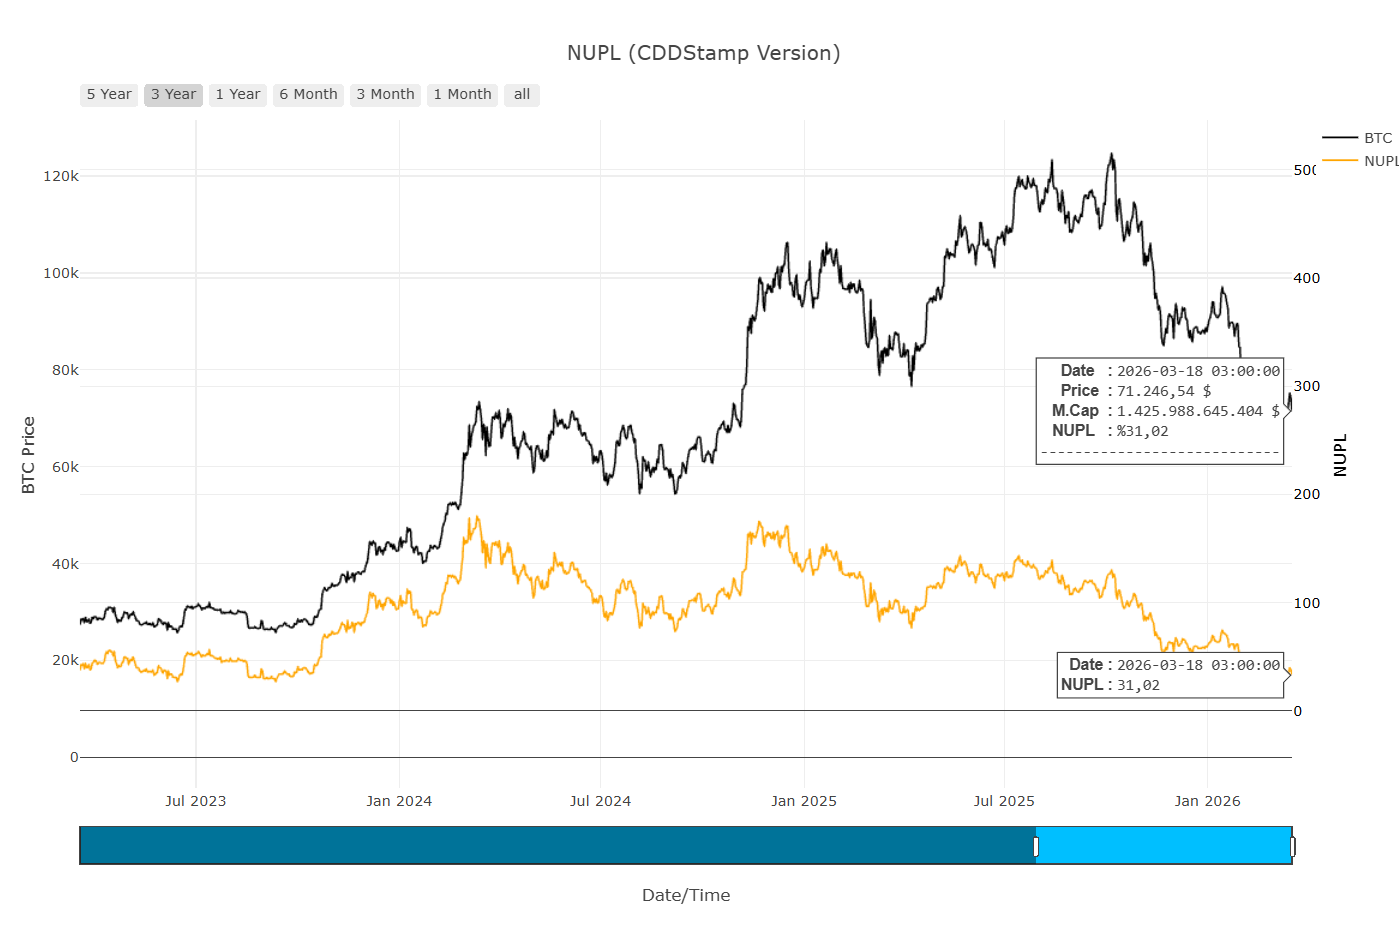
NUPL (Net Unrealized Profit/Loss)
-
Trending downward
-
Not yet in panic or capitulation territory
MVRV Z-Score
-
Around ~1.3
-
Neither undervalued nor overheated
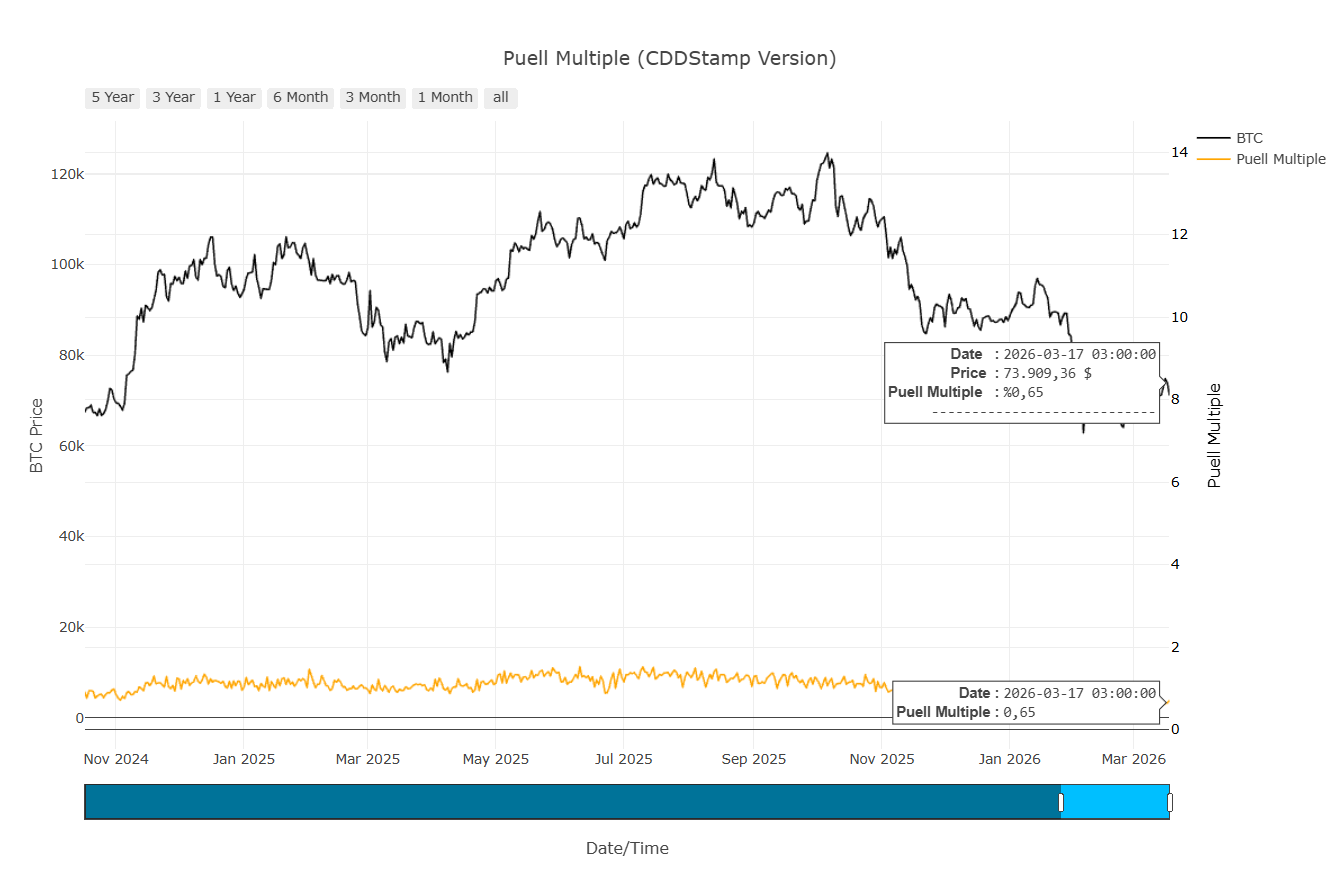
Puell Multiple
-
Low, but not signaling a clear bottom
Taken together:
This doesn’t look like a cycle bottom.
It looks more like a mid-cycle correction.


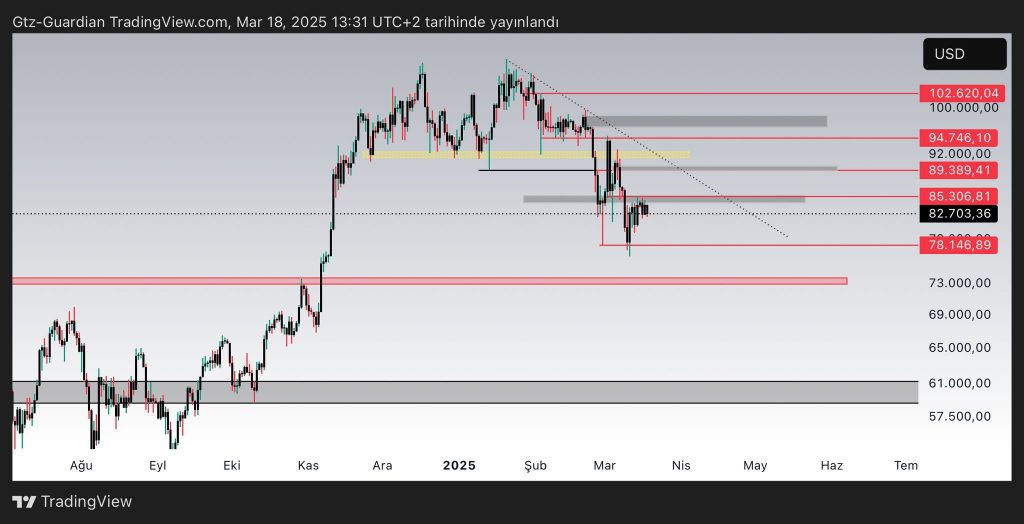
5. Market Structure: The Shift Is Clear
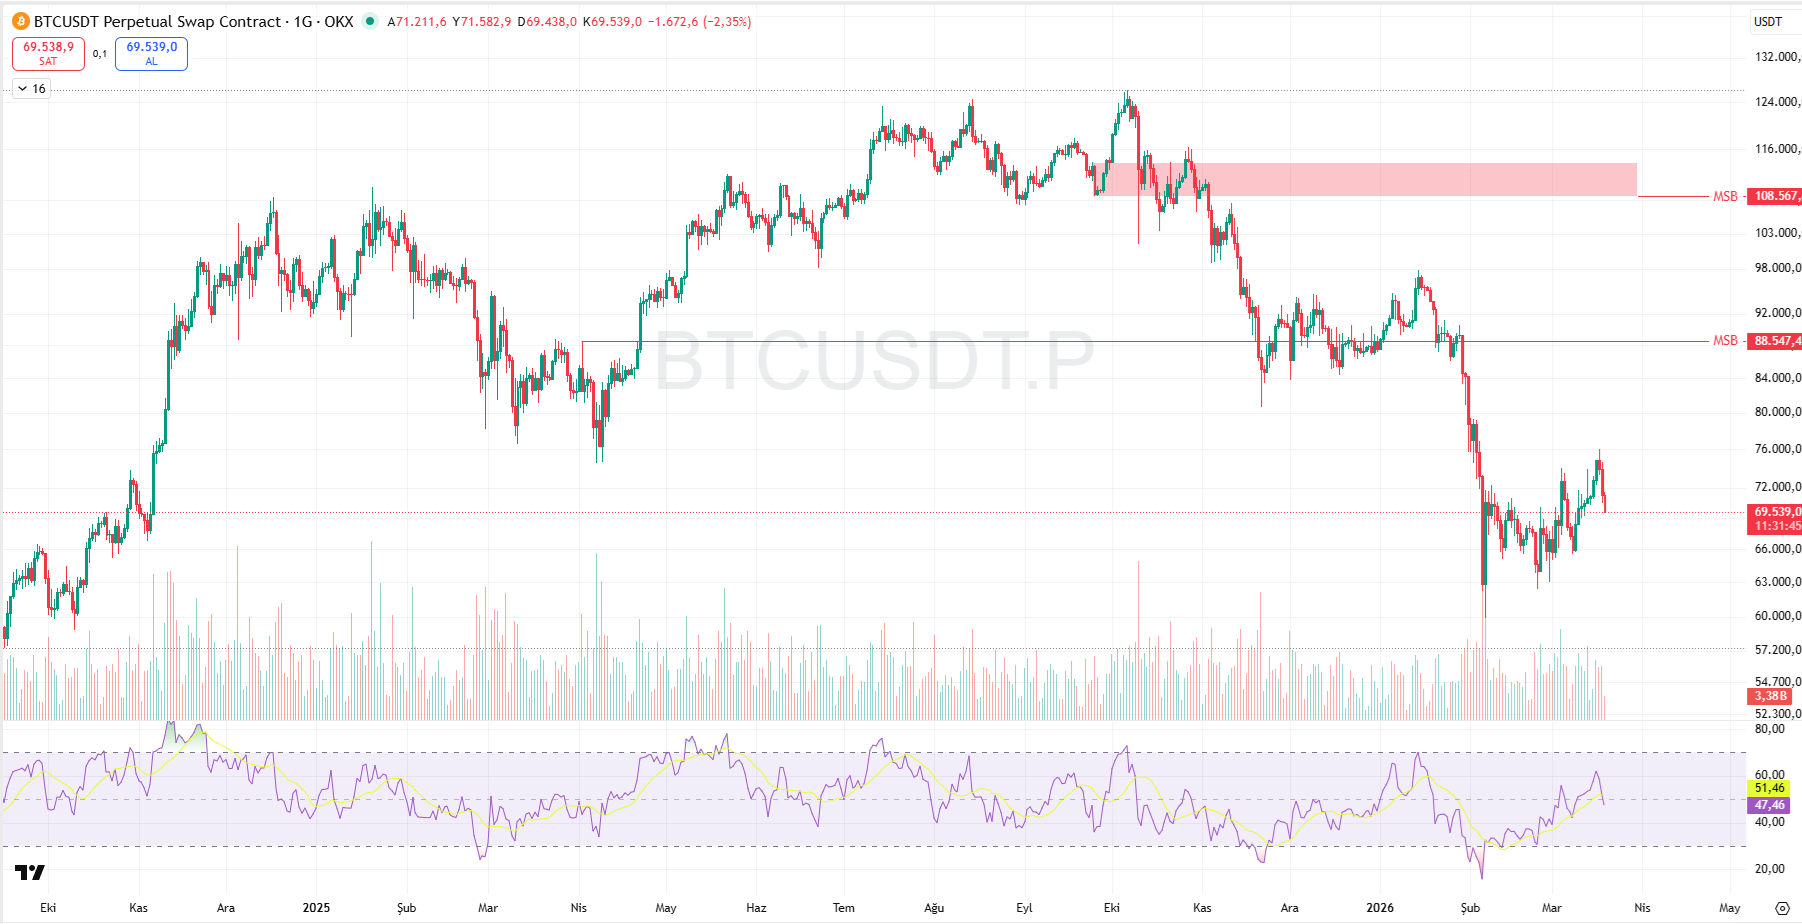
From a price action perspective:
-
A Market Structure Break (MSB) has already occurred
-
The market is printing lower highs and lower lows
-
The most recent bounce formed just another lower high
That matters because:
The structure still favors the downside.
Upper zones are acting as supply areas, meaning rallies are likely to face selling pressure.
The Big Picture
When all the pieces are combined, the message is consistent:
-
Trend: Bearish
-
Structure: Distribution
-
Behavior:
-
Large holders are exiting
-
Retail is entering
-
-
Valuation: Neutral but weakening
-
Regime: Risk-off
Final Take
Bitcoin appears to be in a classic transition phase:
Smart money is quietly exiting while retail steps in.
Historically, this kind of setup doesn’t mark the beginning of a strong uptrend. More often, it’s a pause within a broader downside move.
That doesn’t mean the market can’t bounce. It can—and likely will. But unless key conditions change, those moves are more likely to be temporary.
What Needs to Change?
For a real shift in direction, two things would need to happen:
-
Price reclaiming and holding above the STH level
-
Large wallets returning to accumulation
Without those signals, it’s difficult to argue that the market has truly turned.