The Hidden ETF Script: How Bitcoin Price Is Being Inflated with Fake Volume
As of 2025, the notable surges in Bitcoin prices have reignited bullish excitement among investors. However, when we examine the underlying volume data and on-chain behavior, it becomes evident that this rally is driven more by institutional manipulation tactics than real investor demand.
Particularly, ETF issuers like Grayscale and ARK Invest are creating fake volume by moving their own BTC holdings to and from exchanges without actual sales. This article exposes the fake volume operations with on-chain data support.
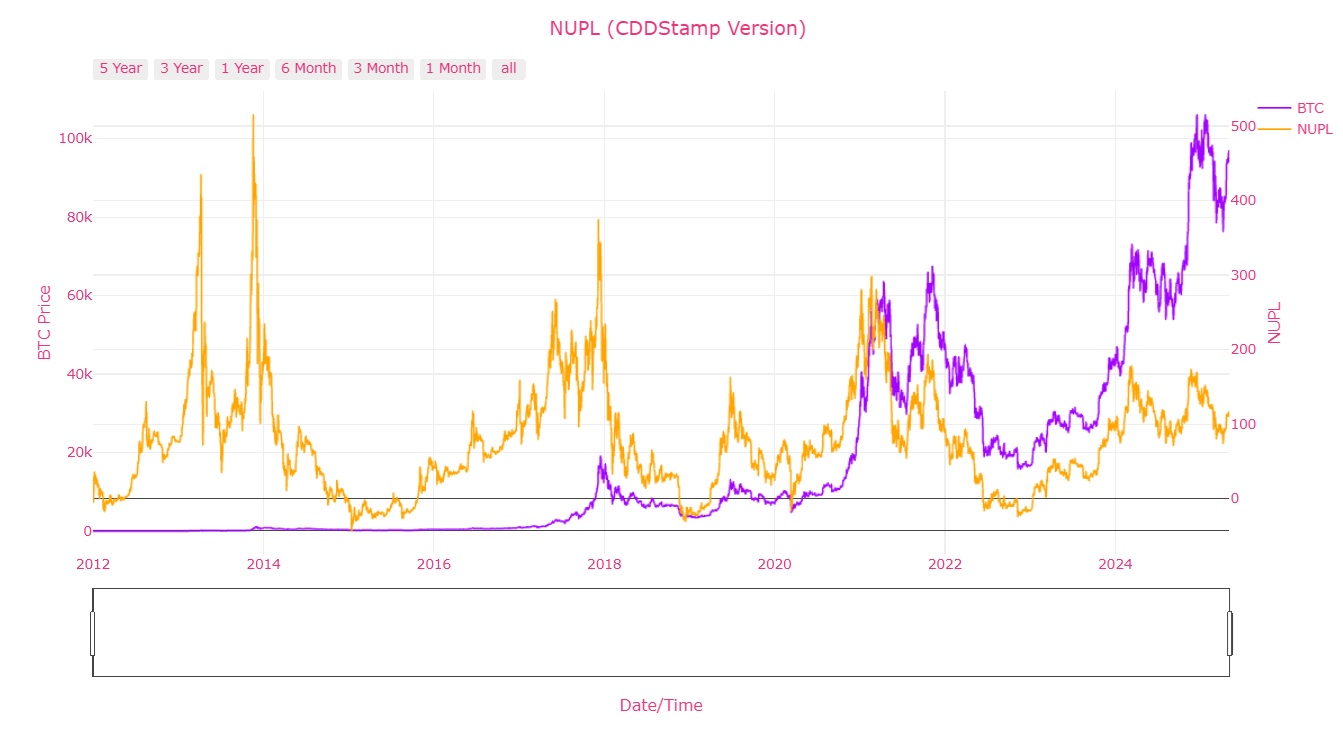
📈 Chart 1: NUPL (Net Unrealized Profit/Loss)
Analysis:
The NUPL indicator shows that most investors are still in profit. The current value is in the 0.5–0.75 range, suggesting a growing risk appetite but not yet in the “euphoria” zone. ETFs reducing their holdings during this stage aligns with a “profit-taking window” narrative, without triggering panic.
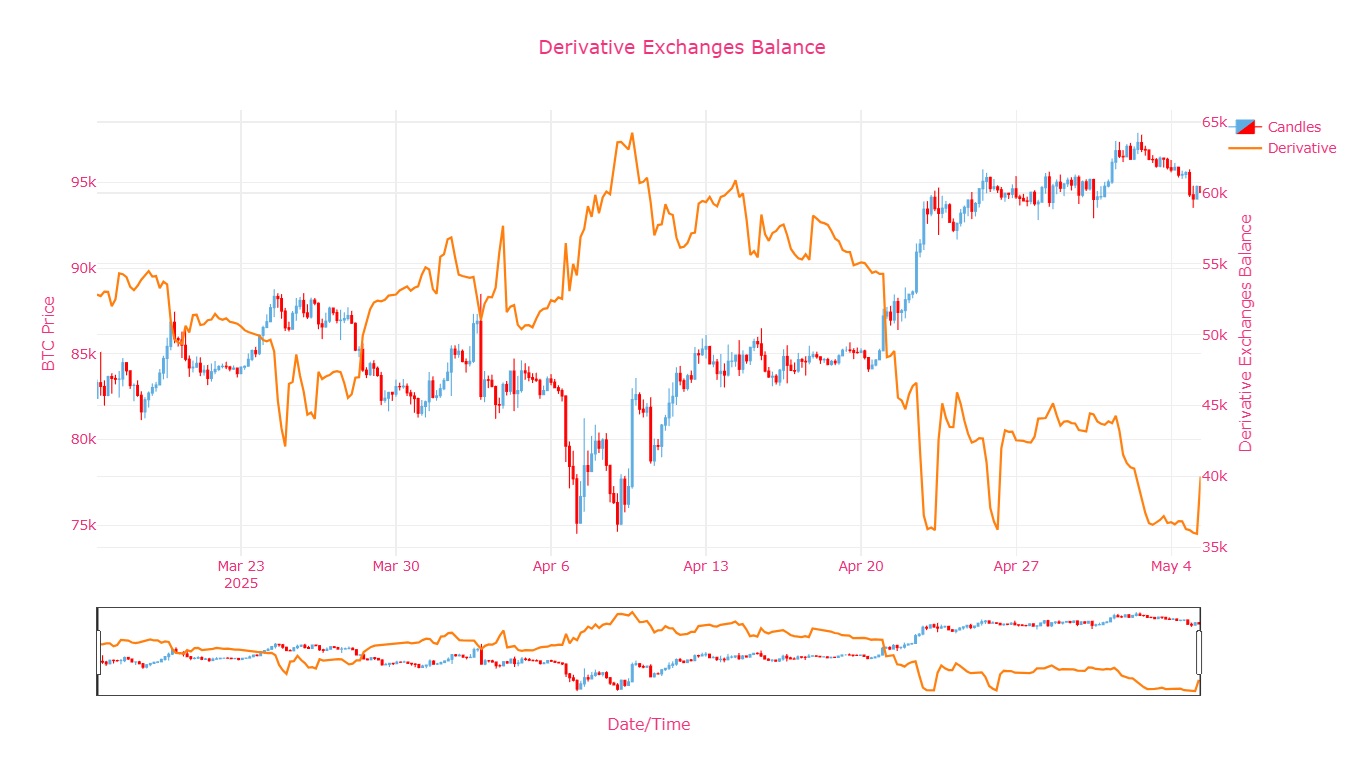
📈Chart 2: Derivative Exchanges BTC Balance
Analysis:
BTC reserves on derivatives exchanges have been rising steadily since mid-April. This signals increased leverage usage and a potential shift of institutional BTC from ETF holdings to derivatives platforms. These inflows likely reflect hedging activity or volume simulation.
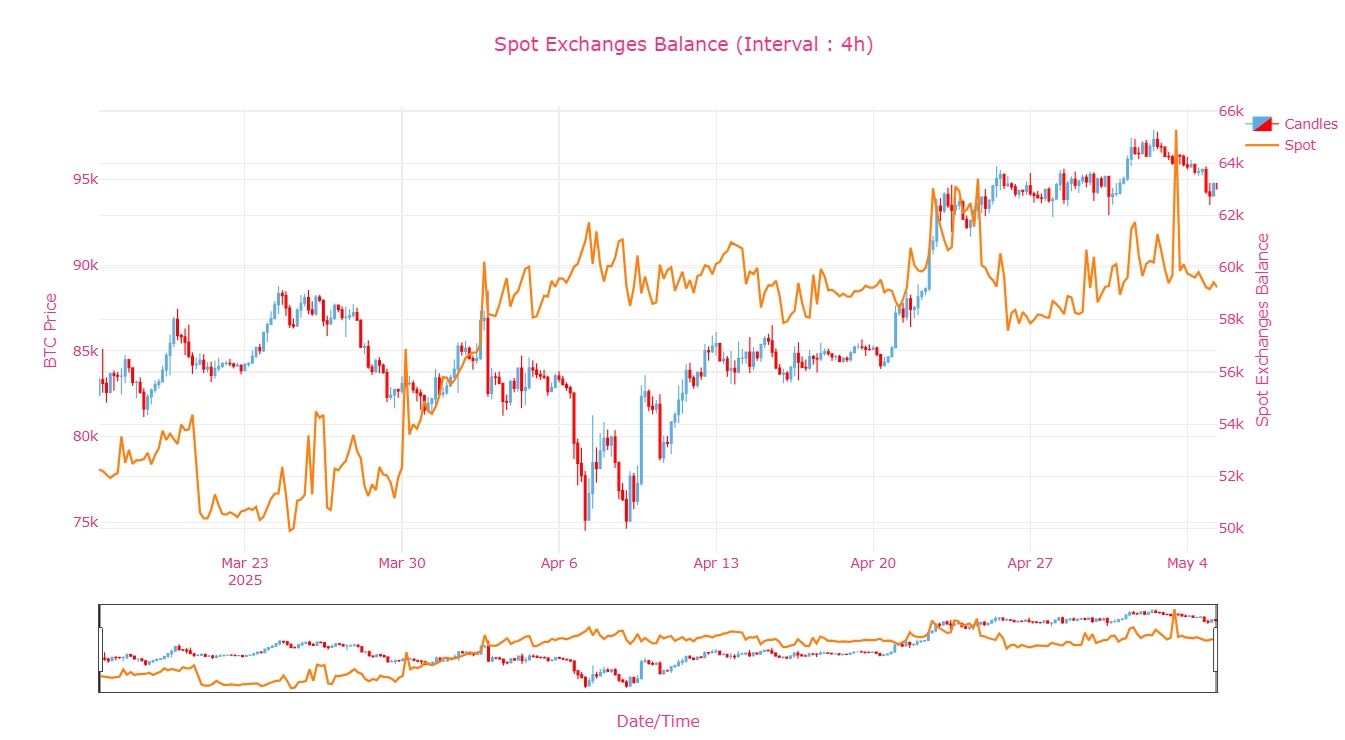
📈 Chart 3: Spot Exchanges BTC Balance
Analysis:
While spot reserves had been on a long-term decline, the recent sideways movement and mild uptick indicate some reversal. This may be due to ETF wallets sending BTC to exchanges, simulating demand without triggering large sell-offs — a classic liquidity illusion tactic.
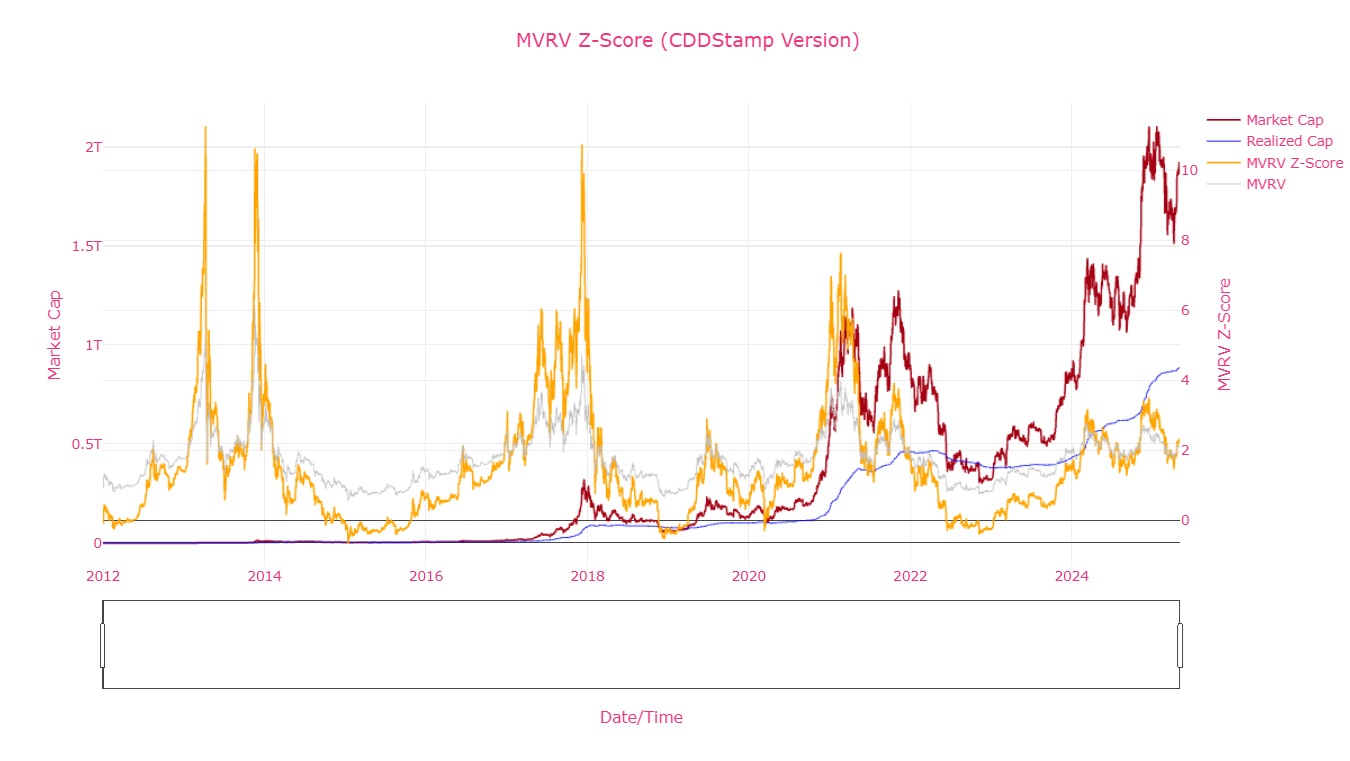
📈 Chart 4: MVRV Z-Score
Analysis:
The MVRV Z-score is hovering between 1.5 and 2.0 — a mildly overheated zone, but far from historical peaks (Z > 7). ETFs may avoid full liquidation in this band and instead create trading volume to exploit optimistic sentiment.
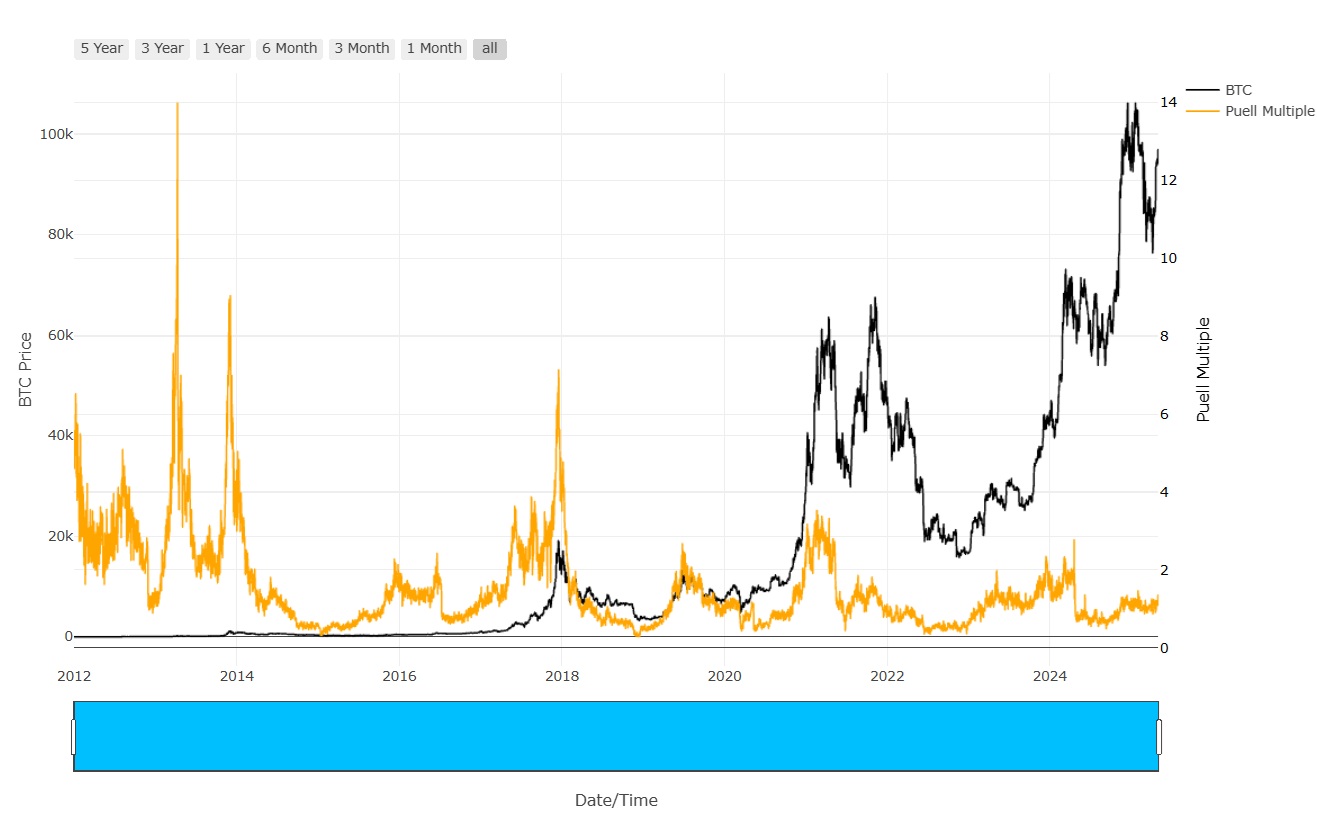
📈Chart 5: Puell Multiple
Analysis:
This chart shows miner revenue remains below historical norms, meaning there’s no miner-driven sell pressure at the moment. ETF outflows, therefore, are unlikely to be reactions to network stress — more likely part of controlled internal rebalancing or tactical flow strategies.
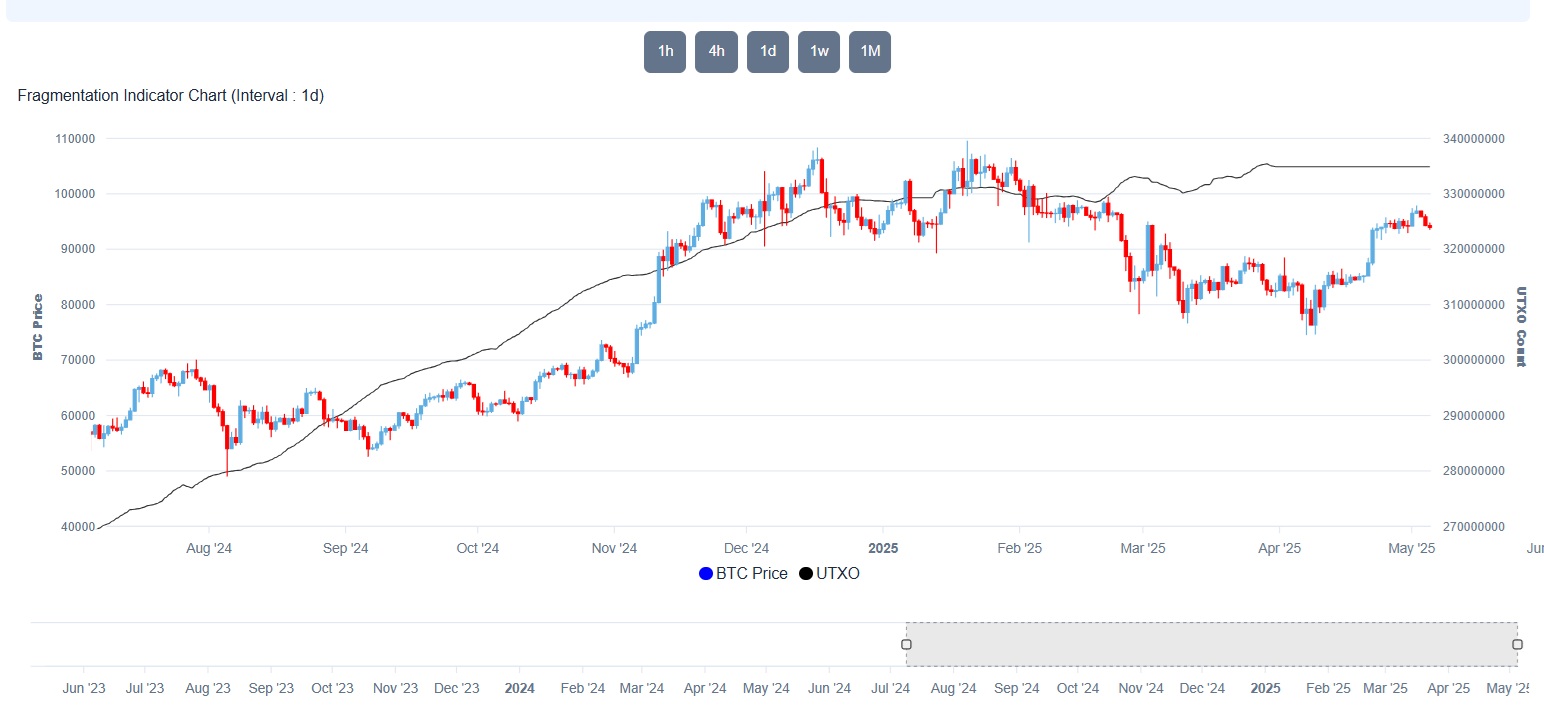
📈Chart 6: UTXO Count (Fragmentation Indicator)
Analysis:
The rise in UTXO count indicates more individual transactions, pointing to increased participation from small users. Despite ETF-driven volume games, organic user activity is expanding, providing a healthy undercurrent beneath the surface noise.
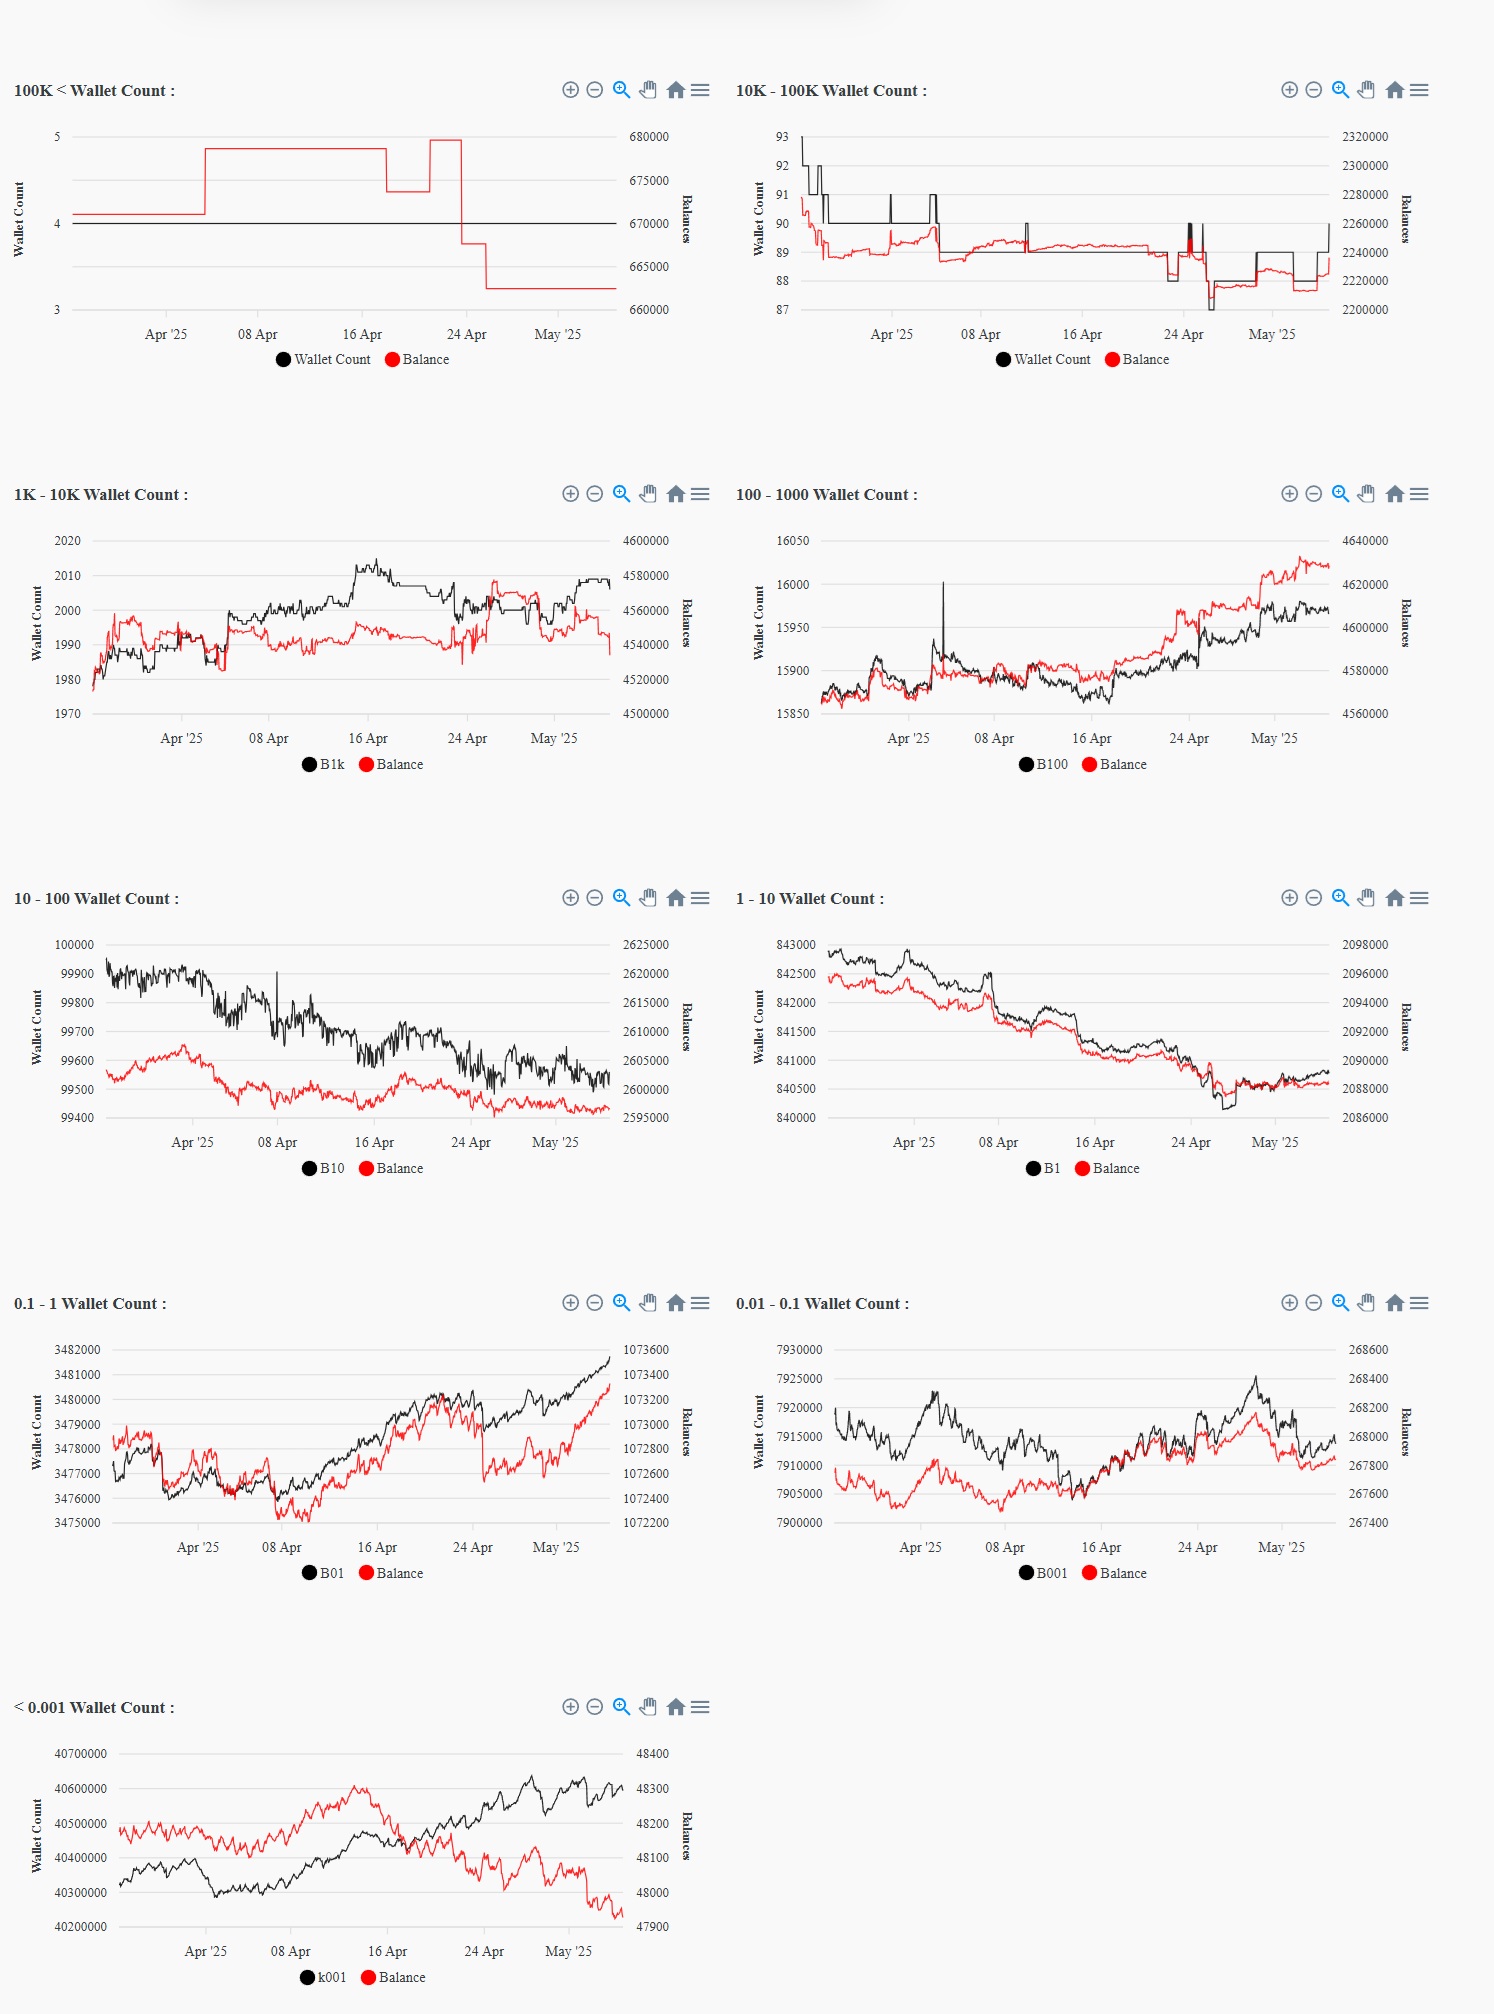
📈Chart 7: Wallet Distribution – Address Count by Holding Size
Analysis:
-
Addresses with 0.001–0.1 BTC are increasing rapidly — indicating retail interest.
-
1–10 BTC wallets are stabilizing or slightly declining.
-
1000+ BTC whale wallets are mostly unchanged.
This shows that larger entities are reducing exposure, while small-scale participants are entering — a classic signal that institutional hands are passing the baton to retail near local peaks.
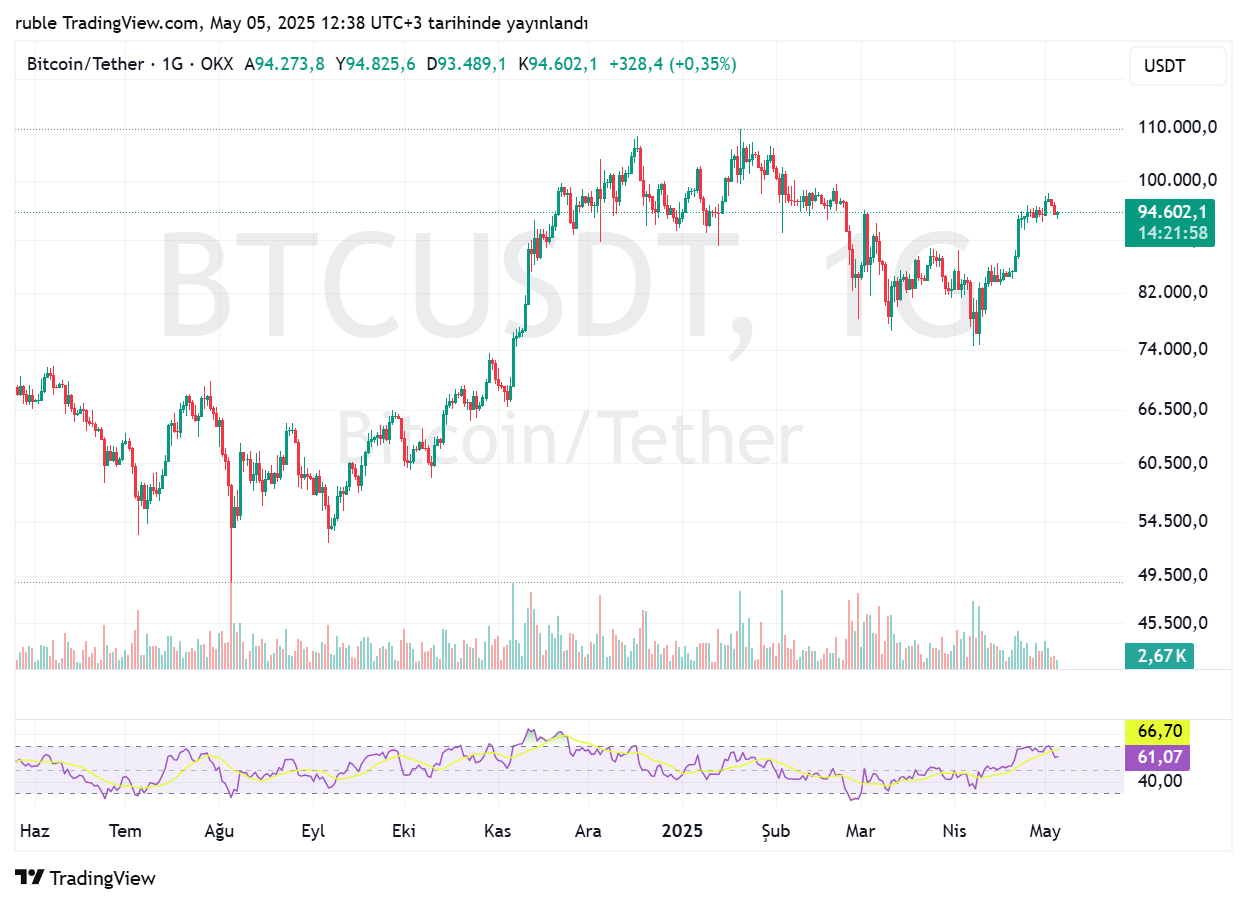
📈 Chart 8: BTC/USDT RSI Chart
Analysis:
RSI has frequently touched the 60–70 range, indicating bullish momentum approaching overbought territory. ETF outflows coincide with these peaks, suggesting a strategy to feed optimism by pushing volume during emotionally charged moments.
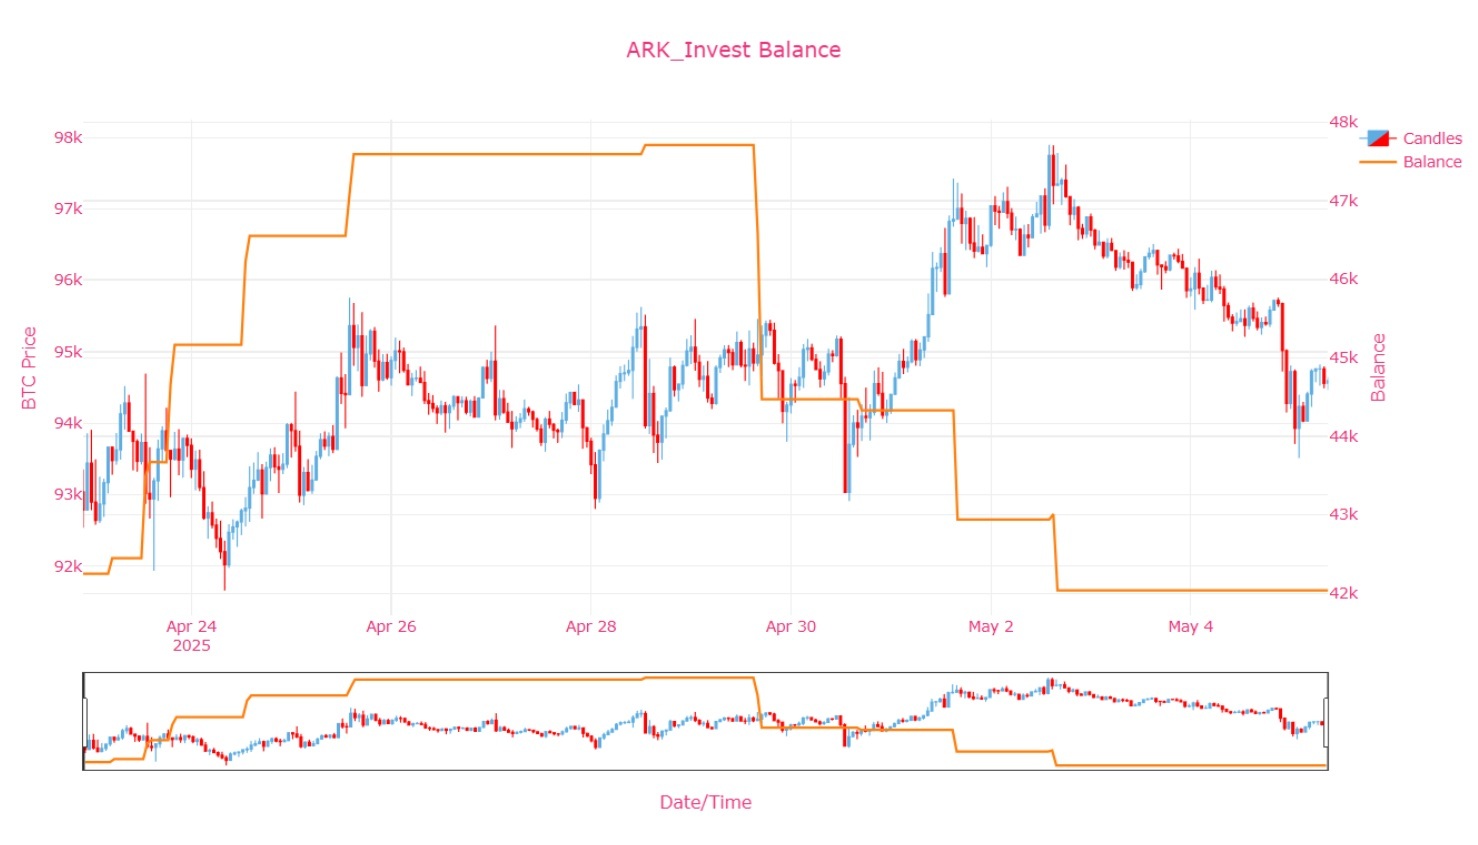
📈 Chart 9: ARK Invest BTC Balance
Analysis:
Between April 24 and May 5, ARK’s balance dropped from 47.8k BTC to 42k BTC. These were gradual withdrawals, likely designed to generate market presence rather than aggressive selling. The stable price action implies volume recycling rather than liquidation.
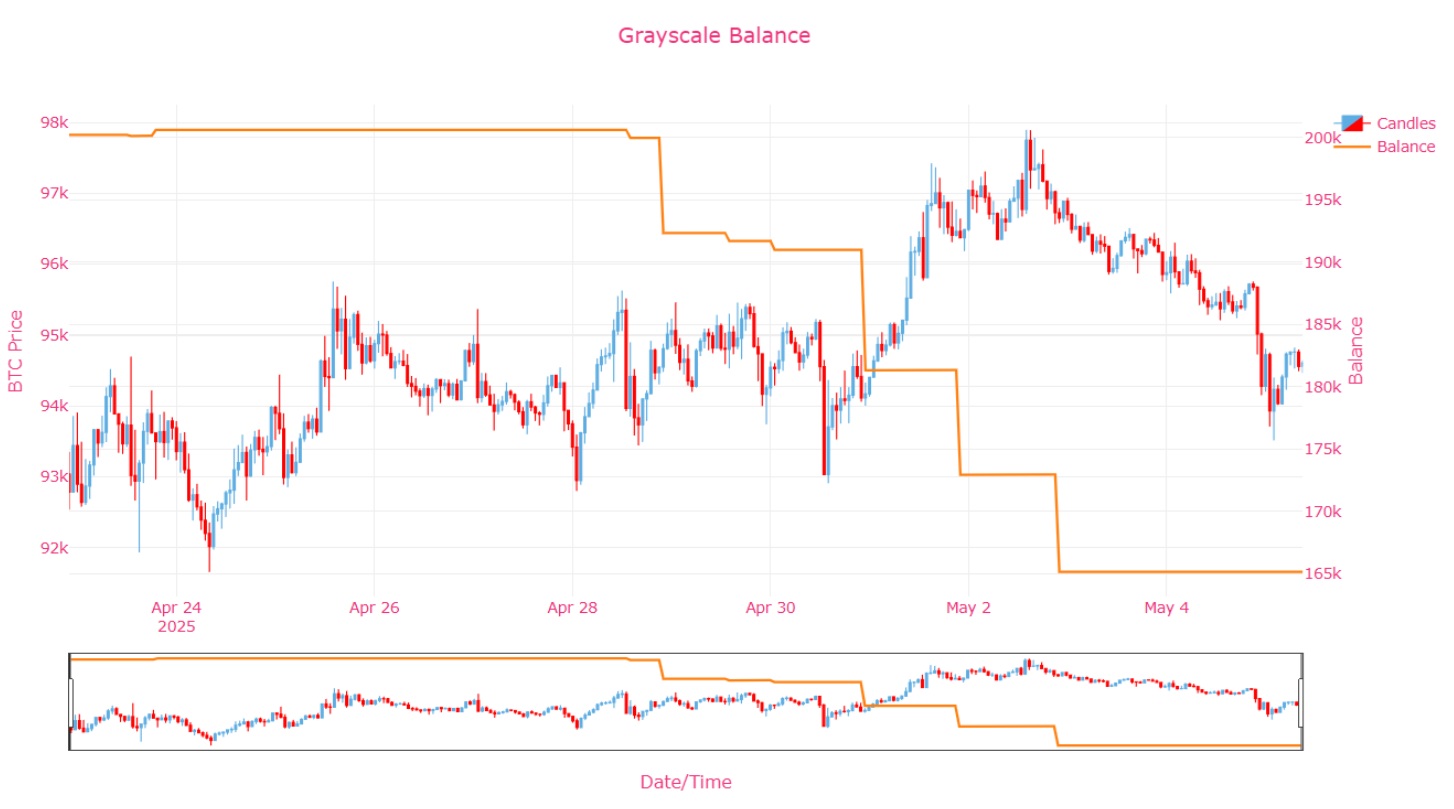
📈 Chart 10: Grayscale BTC Balance
Analysis:
Grayscale’s wallet dropped from 198k BTC to 165k BTC in a short period. Despite this, there was no major price collapse, suggesting these BTC movements were internal transfers or liquidity injections into exchange books — used to inflate volume artificially without sparking market-wide panic.
📌 General Realistic Analysis
While recent Bitcoin price increases may appear to reflect strong demand on the surface, a deeper look reveals a more nuanced picture. The transfer activity from ETFs (particularly Grayscale and ARK) to exchanges contributes to volume engineering, which supports the price momentum — but it’s not the sole driver.
On-chain indicators such as NUPL, MVRV, and UTXO count still reflect healthy investor behavior. Retail participation is growing, and network activity is broadening — showing that this is not purely an institutional spectacle, but also backed by grassroots adoption.
The increase in derivative exchange reserves signals a buildup in leverage, yet spot reserves remain stable, indicating no aggressive selling pressure. Meanwhile, RSI is approaching overbought levels but has not entered a critical zone.
In conclusion:
While ETFs are attempting to shape this market phase through artificial volume, broader macro expectations — like rate cut signals, improving sentiment, and organic on-chain growth — also support the rally.
This isn’t just an illusion — it’s a partially justified move fueled by both narrative and fundamentals.