Based on the latest on-chain and derivative data, here’s a detailed breakdown of current Bitcoin market conditions:
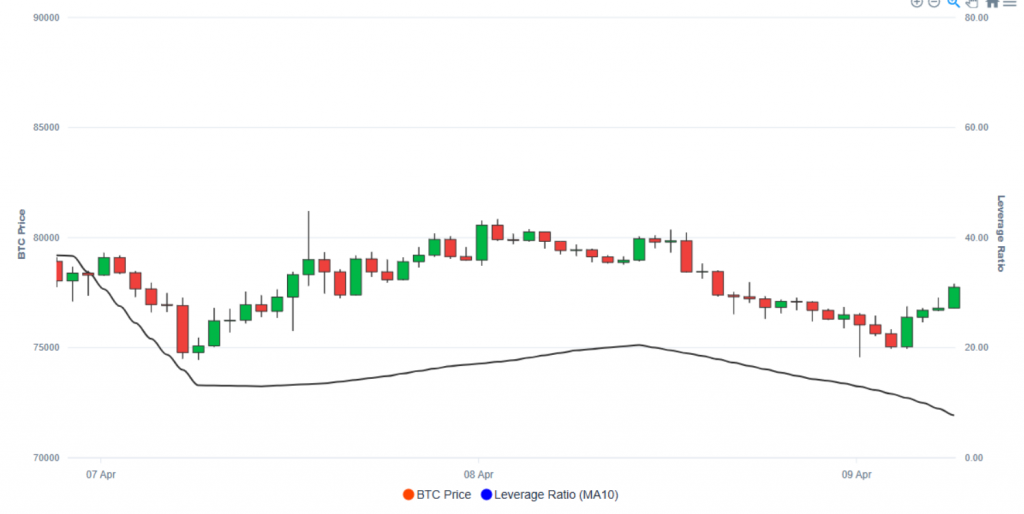
📉 1. BTC Price & Leverage Ratio (MA10)
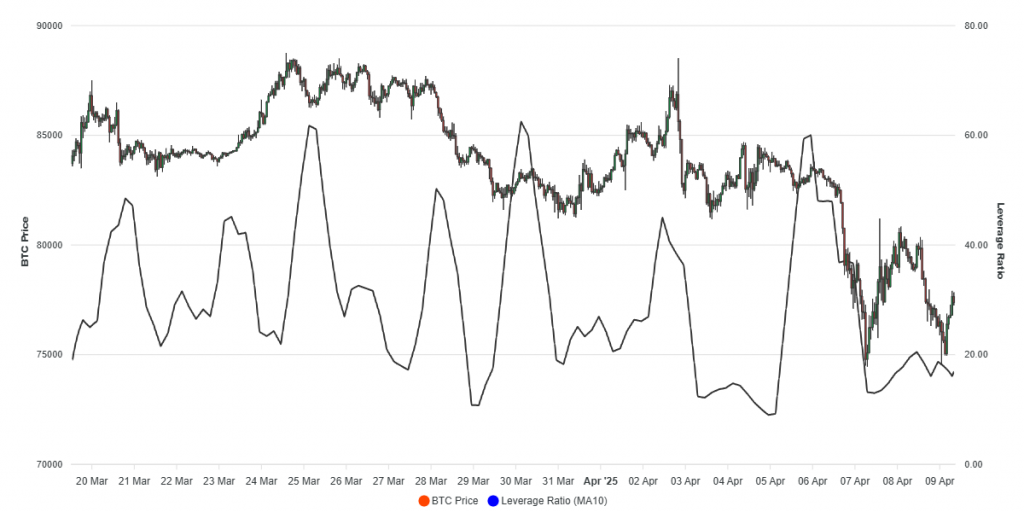
⚙️ Estimated Leverage Ratio = Open Interest / (Funding Rate × Mark Price)
-
The estimated leverage ratio (10-day moving average) tends to rise before sharp price drops. This typically indicates that over-leveraged long positions are being liquidated.
-
Notable spikes occurred around March 25, April 1, and April 6 — all followed by strong downward moves in BTC price.
-
After the most recent drop, the leverage ratio has significantly decreased, suggesting many leveraged positions have been closed, potentially resetting the market for healthier movement.
 Sign up for free on CDDStamp today and get one-month access to our AI predictor, sezAI, for crypto and stock market forecasts.
💸 2. Funding Rates (Cumulative & Binance)
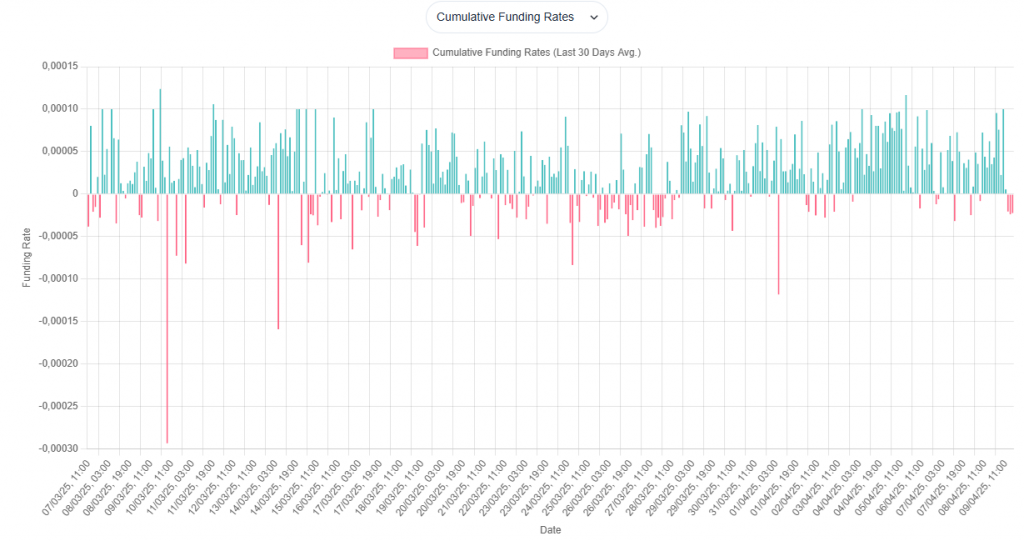 Cumulative Funding Rates
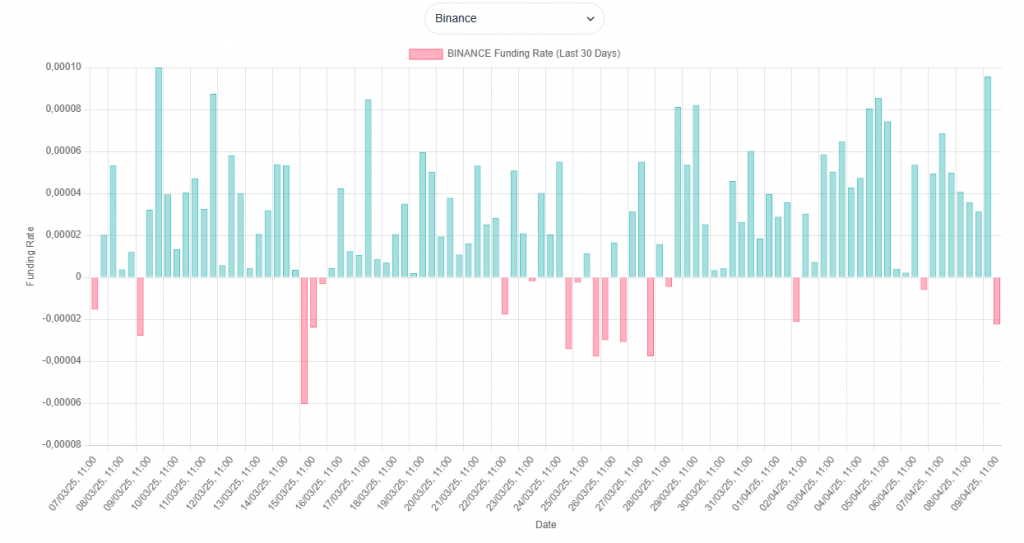
Binance Funding Rates
-
Over the last 30 days, funding rates have frequently turned negative.
-
On Binance specifically, negative funding has appeared often, hinting that:
Either short positions are dominant or excessive long exposure is being corrected.
-
This behavior aligns with a market going through a cooling-off phase or correction.
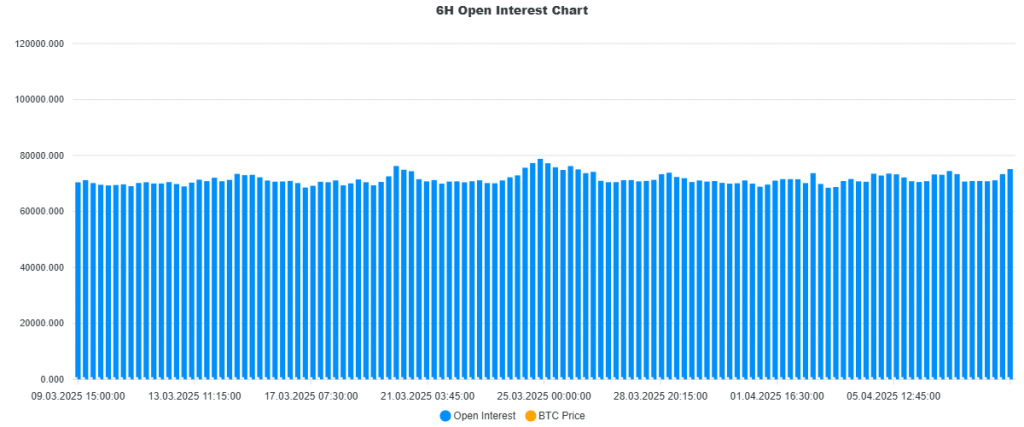
📊 3. Open Interest (4H Chart)
-
Open interest has remained relatively flat since March 9, with no major spikes in new positions.
-
When price drops while OI remains high, it generally indicates long liquidations.
-
This points to risk-off sentiment with participants not aggressively opening new positions.
Sign up for free on CDDStamp today and get one-month access to our AI predictor, sezAI, for crypto and stock market forecasts.
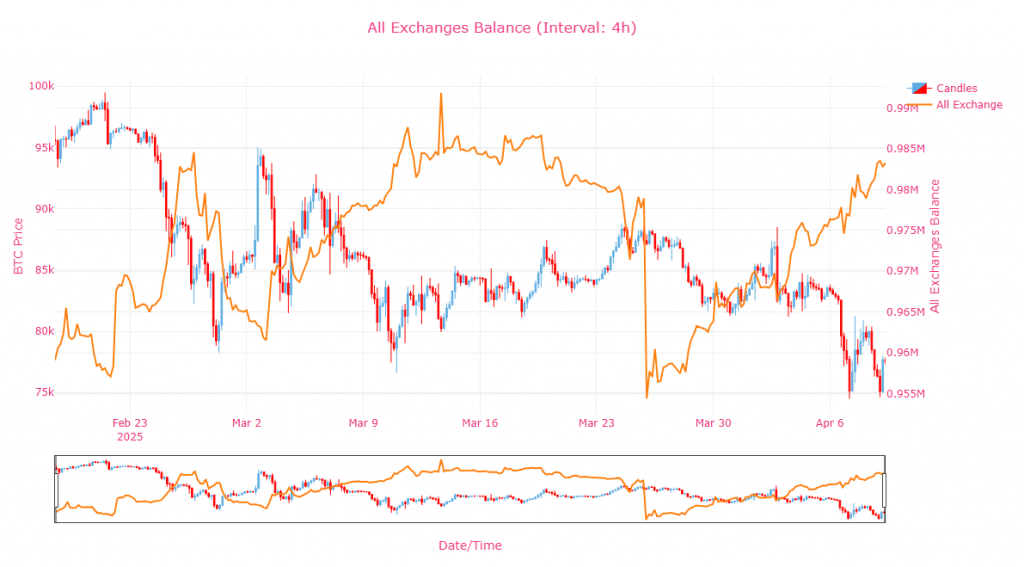
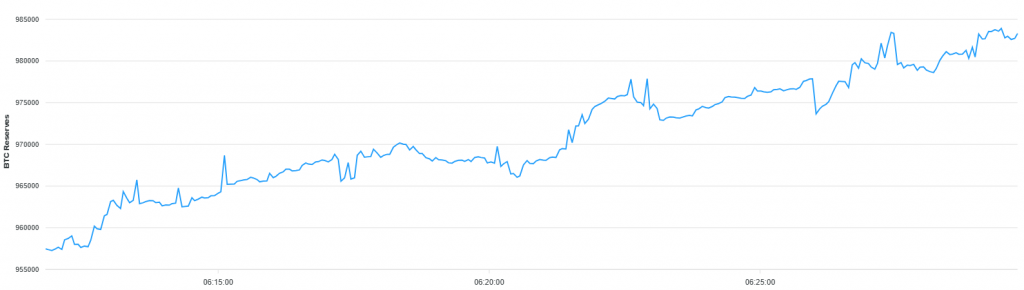
🏦 4. Exchange Reserves
-
BTC balances held on exchanges are increasing, especially in early April.
This usually means that users are moving coins to exchanges with the intent to sell.
-
The rise in reserves while price declines supports the theory of increasing sell-side pressure.
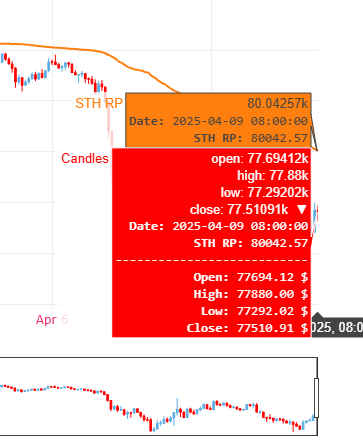
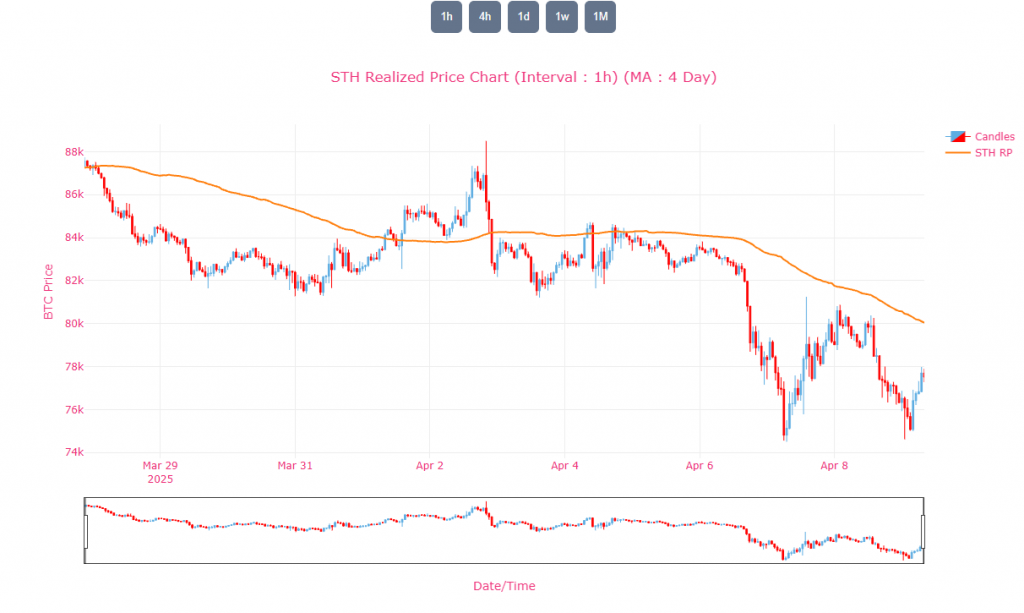
🧠 5. Short-Term Holder Realized Price (STH RP)
-
The STH Realized Price currently sits at $83,443, while the market price is below it.
-
This suggests that short-term holders are in a losing position.
-
Typically, this reduces immediate sell pressure, as traders prefer not to sell at a loss.
🔍 6. UTXO Count & Fragmentation Indicator

-
The number of UTXOs is steadily rising, even as price falls.
-
This implies an increase in on-chain activity — potentially due to:
-
Smaller transactions from retail users,
-
Wallet reorganization,
-
Or preparation for spending.
-
Sign up for free on CDDStamp today and get one-month access to our AI predictor, sezAI, for crypto and stock market forecasts.
🔔 Conclusion & Outlook
-
Leverage has dropped, signaling a market reset post-liquidations.
-
Funding rates are negative, suggesting bearish or corrective sentiment.
-
Exchange reserves are increasing, hinting at possible further sell pressure.
-
Short-term holders are underwater, which may reduce panic selling.
-
Open interest is flat, meaning no strong momentum from derivatives traders.
Short-Term View: A weak bounce may follow, but caution is advised due to rising exchange reserves and flat OI.
Key Support Levels: $77K–$75K zone
Mid-Term: Watch for changes in leverage ratio, funding rate trends, and exchange balances for clues of reversal or continued pressure.