
1. 🧠 On-Chain Analysis
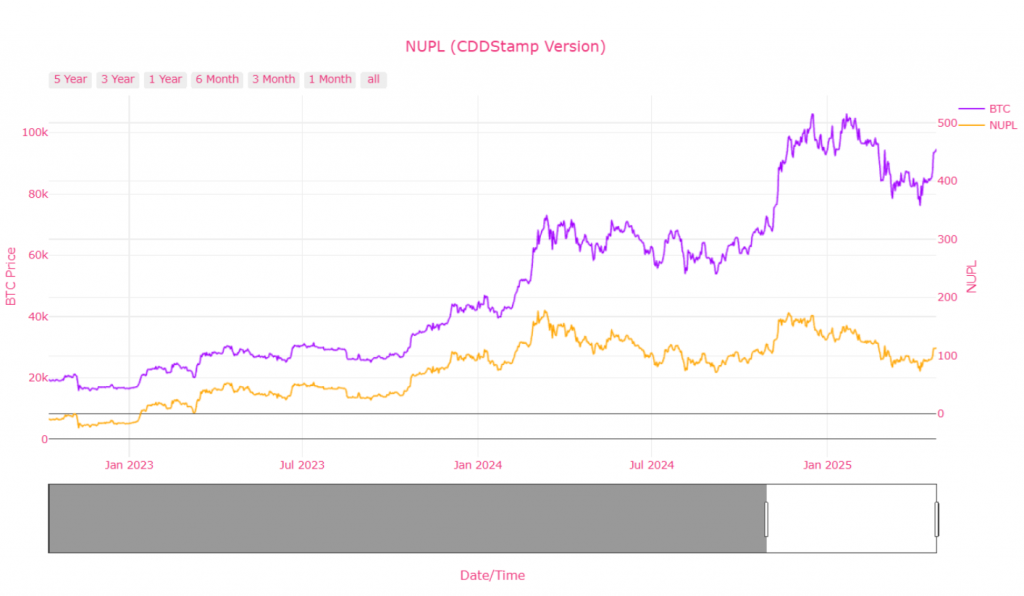
📊 NUPL (Net Unrealized Profit/Loss)
-
Current Status: NUPL remains in the positive zone (above 100%), but has been trending downward since the beginning of the year.
-
Comment: A significant portion of investors are still in profit. However, the decline in NUPL suggests profit-taking and a potential market saturation point approaching.
🚀Join CDDStamp for free and unlock instant access to these powerful insights — no cost, just alpha.
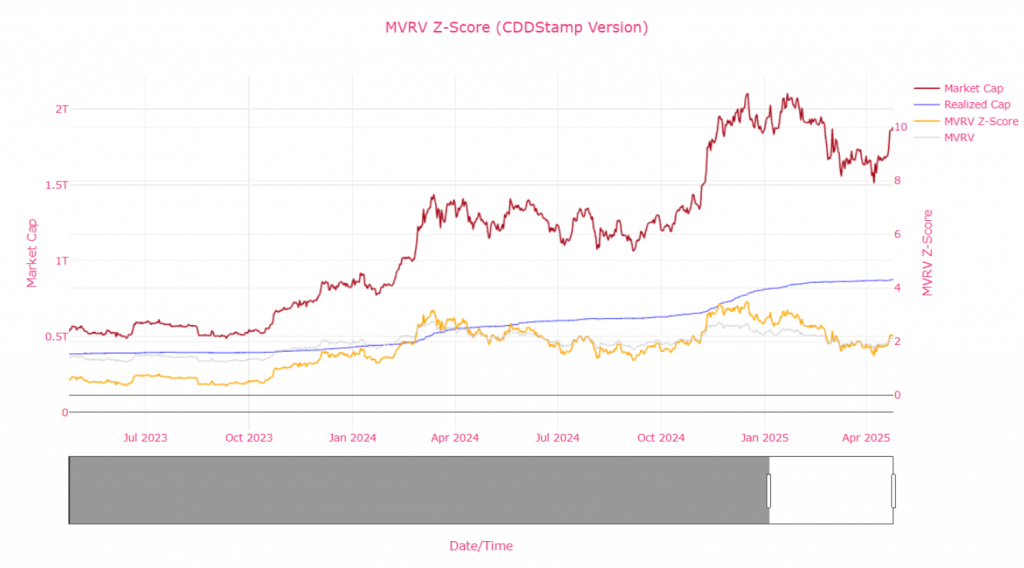
🔍 MVRV-Z Score
-
Observed Level: Recently tested above 10 and is now decreasing.
-
Comment: Historically, this level coincided with market tops. The current descent from overvalued territory may signal a consolidation or a potential correction phase.
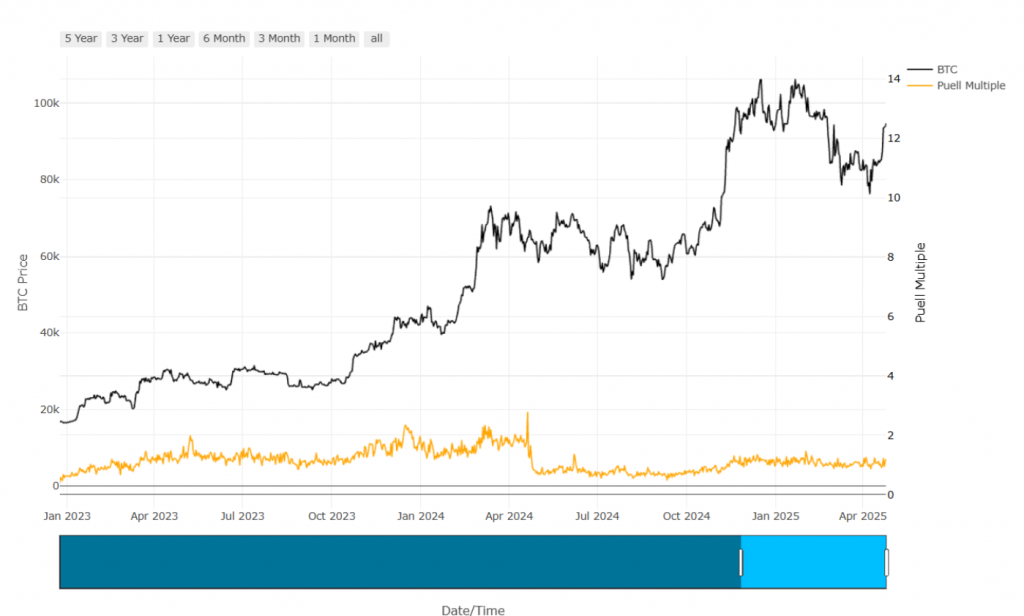
💡 Puell Multiple
-
Level: Around 1.5 and moving sideways.
-
Comment: Miner revenue has not yet reached overheated levels, indicating room for further growth and no significant sell pressure yet.
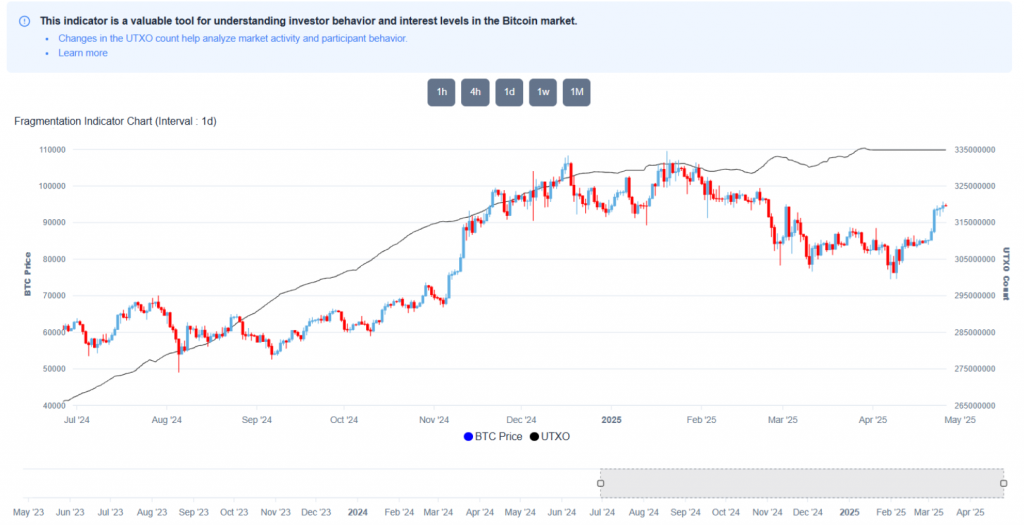
📈 UTXO Fragmentation (Fragmentation Monitor)
-
UTXO Count Rising: Sharp increase observed since March.
-
Comment: Indicates new retail investor participation and broader market engagement. Often a precursor to bullish momentum.
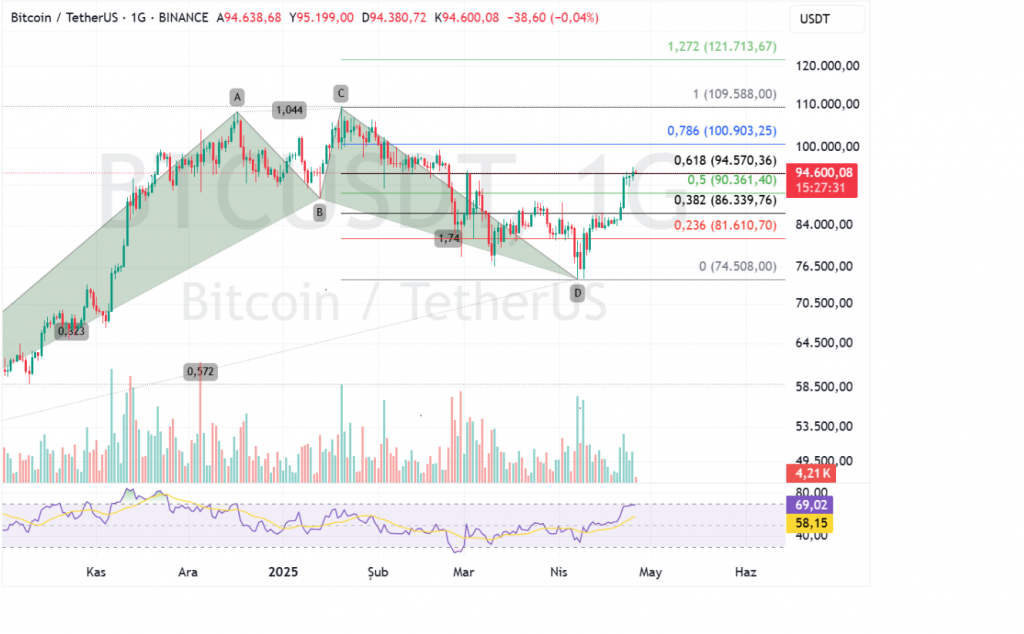
🚨 Block Anomaly Monitor
-
Status: High UTXO outflows and transaction volumes detected. Anomaly frequency is increasing.
-
Comment: May signal movements by large players or institutions. Volatility may increase in the short term.
-
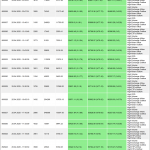
Click on the image to enlarge it.
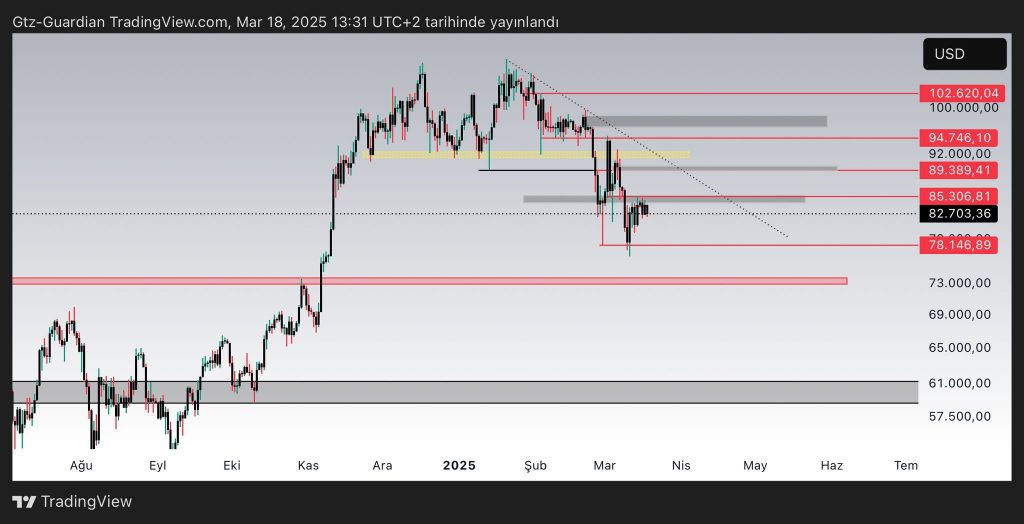
2. 📉 Technical Analysis
🚀Join CDDStamp for free and unlock instant access to these powerful insights — no cost, just alpha.
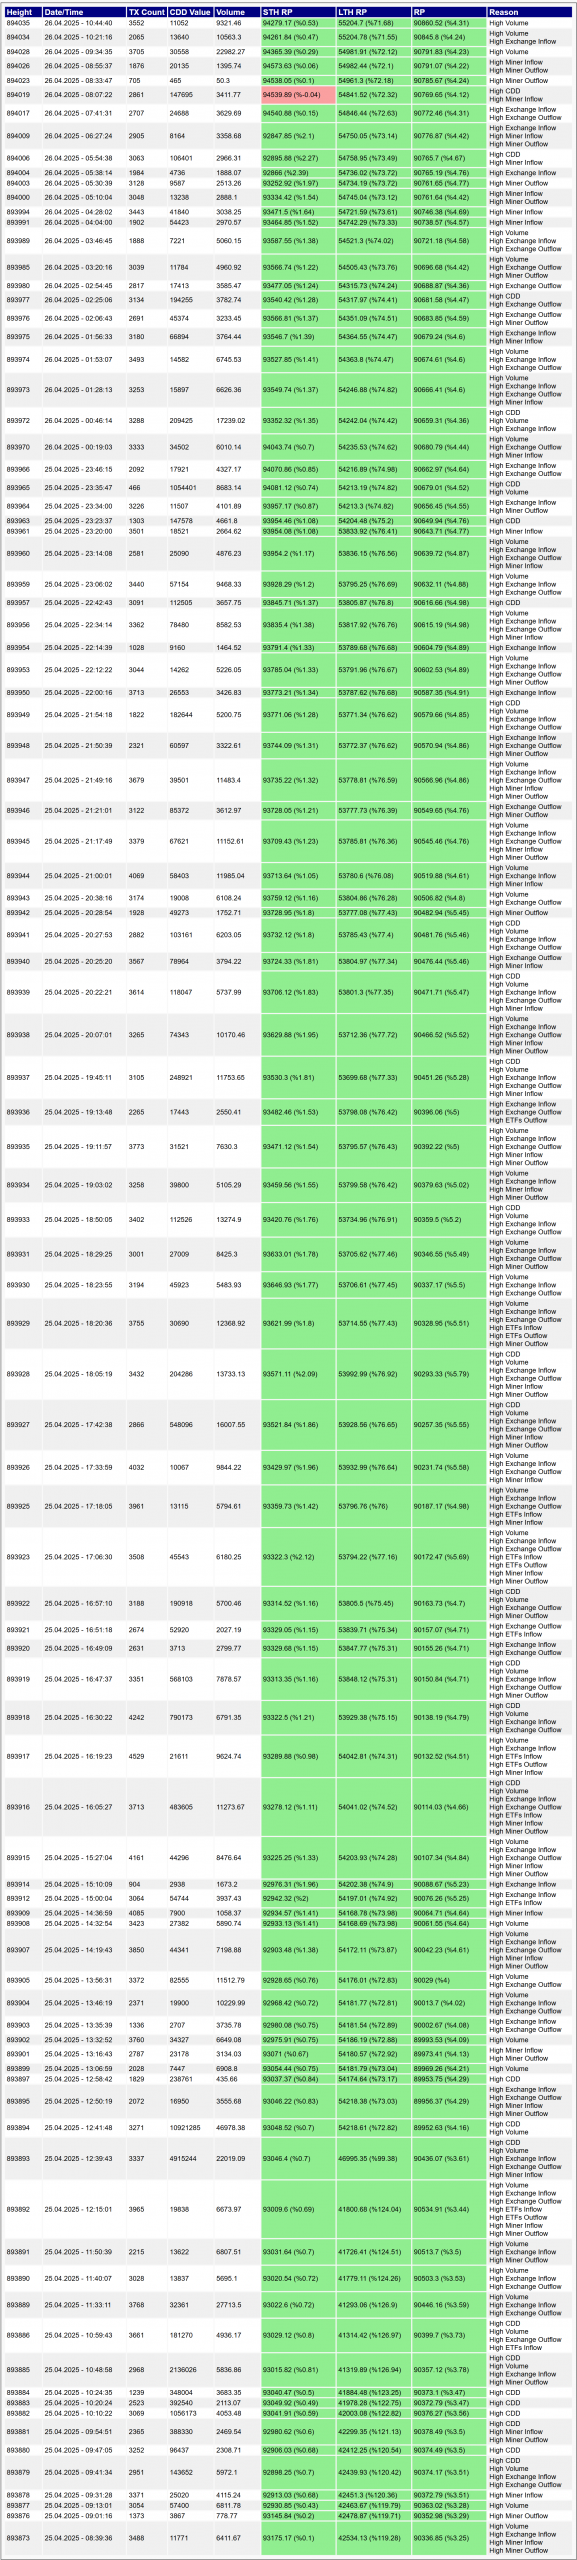
📌 Harmonic Pattern: ABCD Structure
-
Pattern: A clear AB=CD formation has completed on the chart, with point D acting as a strong reversal zone.
-
Comment: The bounce from point D confirms a potential trend reversal and the completion of the harmonic structure.
📐 Fibonacci Retracement Levels
-
Resistance Levels:
-
0.618: $94,570
-
0.786: $100,903
-
1.000: $109,588
-
-
Support Levels:
-
0.5: $90,361
-
0.382: $86,339
-
-
Comment: The $94.5K zone is a critical resistance. If broken, price may move toward the $100K–110K area. A drop below $90K could trigger stronger pullbacks.
📊 RSI (Relative Strength Index)
-
Level: 69.02 – nearing overbought zone.
-
Comment: Strong bullish momentum, but approaching overbought conditions. A short-term correction is possible.
📉 Volume Analysis
-
Comment: Rising volume alongside price increases suggests healthy buying activity. Sustained growth will require continued buyer interest.
🔚 Summary Overview
| Indicators | Commentary |
|---|---|
| NUPL | High unrealized profits → Risk of profit-taking |
| MVRV-Z | Signs of reversal from overvalued territory |
| Puell Multiple | Neutral level → Still room for upside |
| UTXO Fragmentation | Increased retail participation → Potential start of new bull cycle |
| Technical Pattern | AB=CD completion → Bullish reversal underway |
| Fibonacci Zones | Watch $94.5K and $100.9K as key resistance levels |
| RSI | Nearing overbought → Potential short-term pullback |
🧭 Strategy Suggestion
-
Short-Term Traders: Consider breakout plays above $94.5K with a target around $100.9K.
-
Mid-to-Long-Term Investors: On-chain signals support long-term holding as retail interest grows.
-
Risk Management: Monitor RSI and MVRV-Z for overheating signs. Key support range lies between $86K and $90K.
Maşallah
Eğer 93.800 kırılırsa düşüş hızlanabilir (çünkü orası tam destek).
Eğer 93.800 üzerinde çok güçlü bir yeşil mum görürsen →
→ kısa vadede bir kısmı karla kapatıp stopu daha aşağı çekmek mantıklı olur.
Güzel fikir, akıllıca teknik.