🔍 STH Realized Price (Short-Term Holder Realized Price) Analysis
📌 Definition & Importance
The STH Realized Price indicates the average cost basis of investors who purchased Bitcoin within the last 155 days.
Prices above this level typically represent profitable positions for short-term holders (STH), while prices below it suggest those holders are at a loss.
This metric is crucial for understanding market sensitivity, particularly where potential selling pressure may intensify.
🧭 Multi-Timeframe Analysis
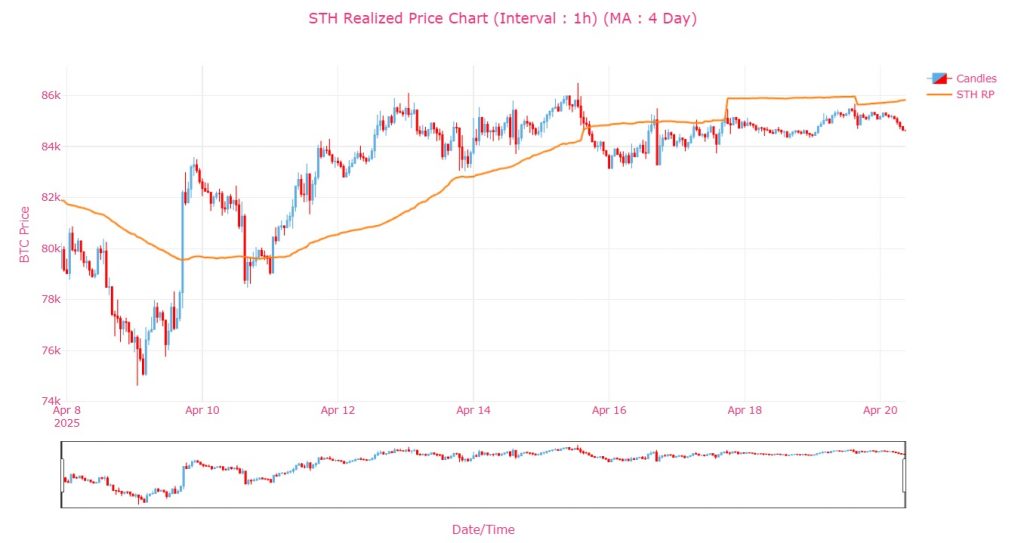
🕐 1-Hour Chart (4-Day MA)
BTC is trading slightly above the STH RP.
Short-term holders are in profit, which could support price stability or upward momentum in the near term.
However, sudden sell pressure may trigger a retest of this level. Currently, the outlook is neutral to positive.
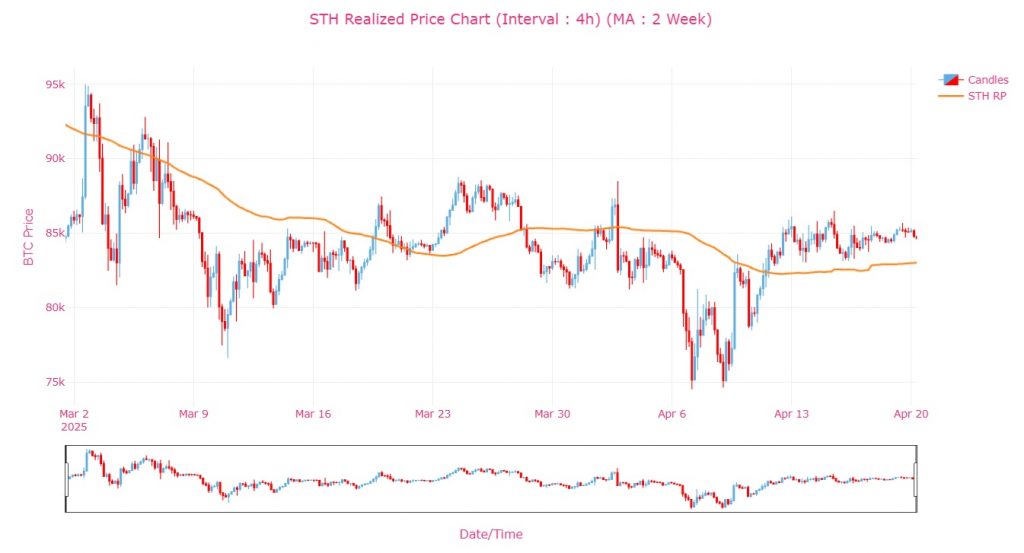
⏳ 4-Hour Chart (2-Week MA)
BTC is hovering just above the STH RP level.
This area may act as resistance; for the upward trend to continue, this level must hold as support.
If price drops below the STH RP, panic selling could intensify.
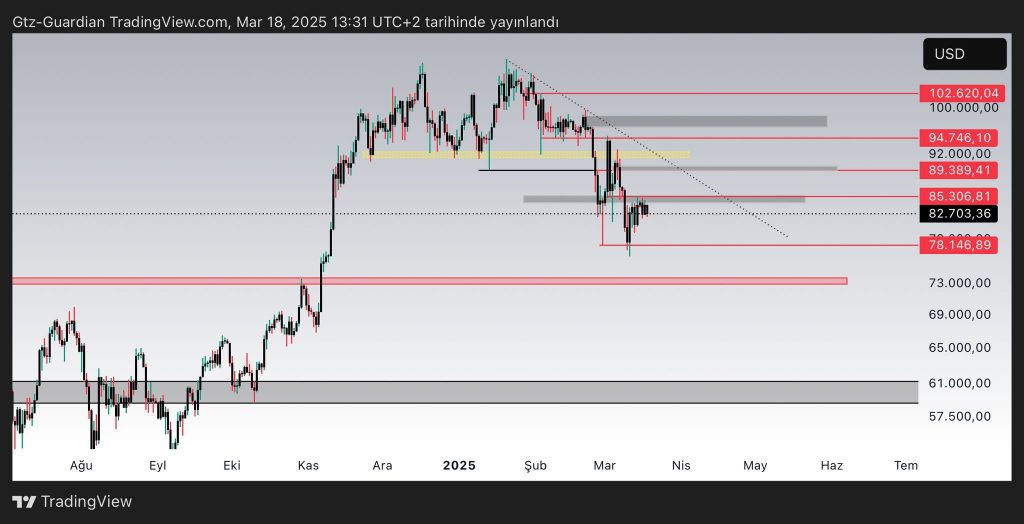
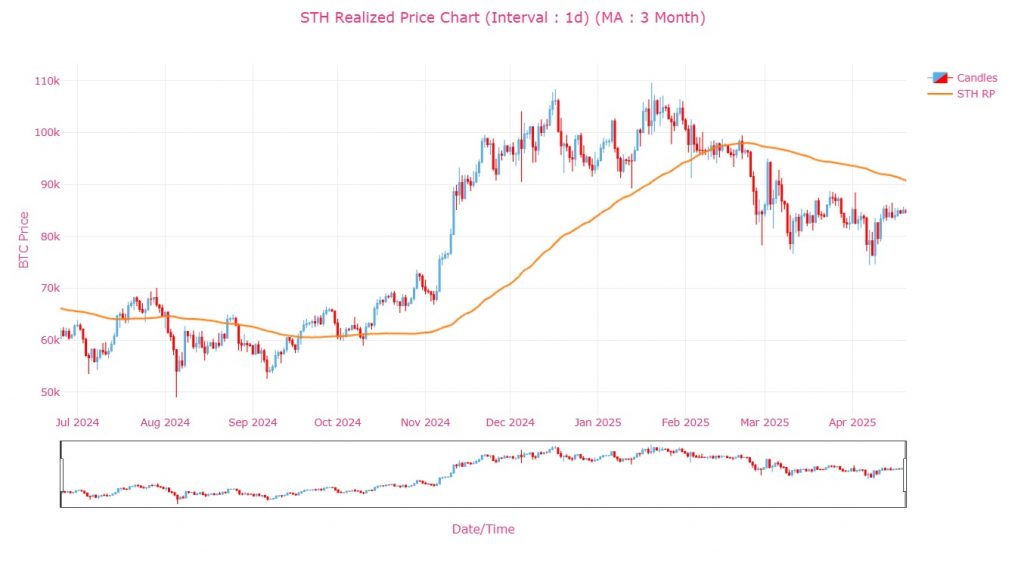
📅 Daily Chart (3-Month MA)
STH RP has been trending downward, but BTC has recently climbed above it.
If BTC holds above this level, a new upward trend may form. Otherwise, a retest of lower levels is likely.
This indicates prices are near the average cost of medium-term investors.
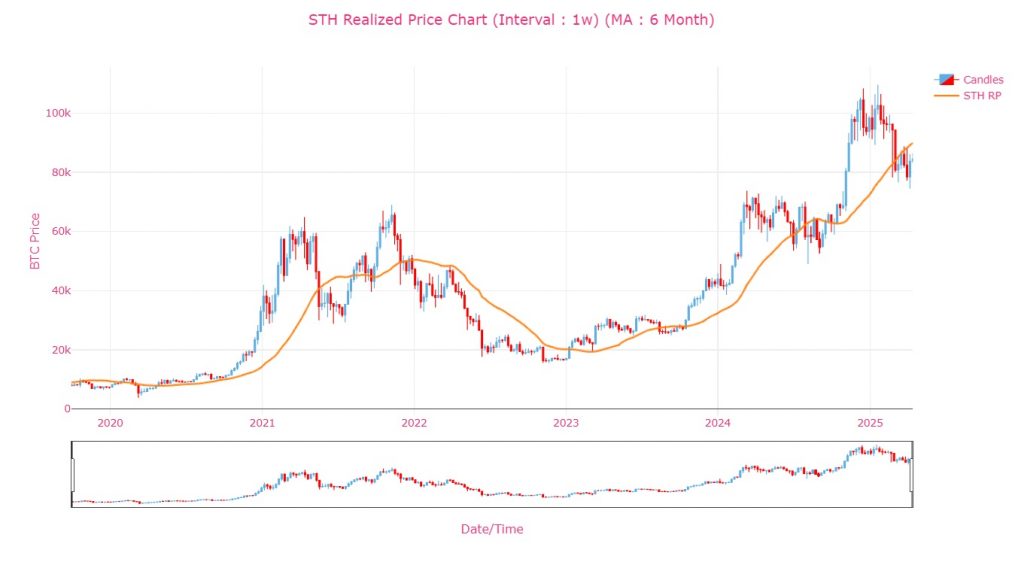
📆 Weekly Chart (6-Month MA)
BTC is slightly above the STH RP, but momentum appears to be weakening.
If this level holds, it could form a solid long-term support base.
However, a breakdown would confirm waning momentum.
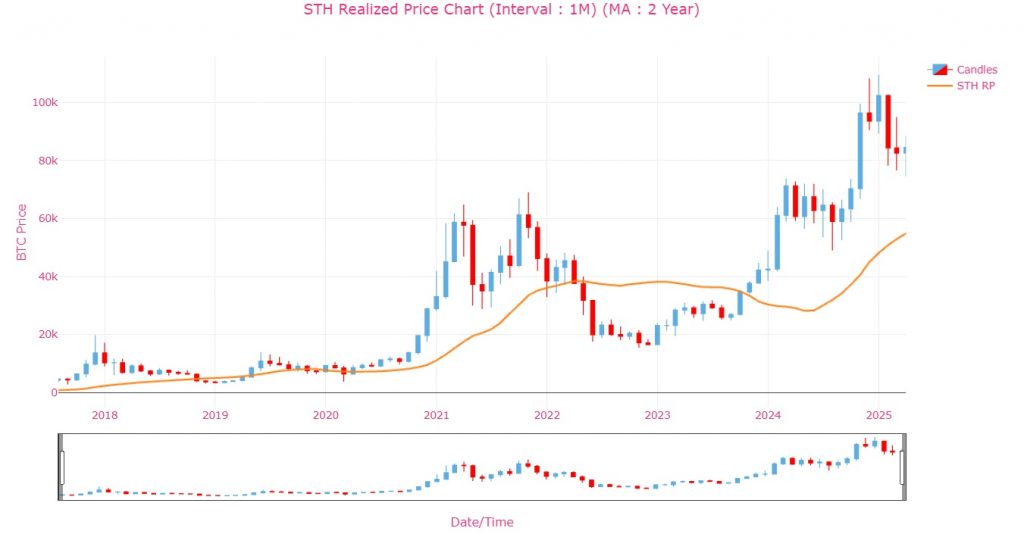
🗓️ Monthly Chart (2-Year MA)
On a macro level, the STH RP remains in a strong uptrend.
This suggests a constructive structure for long-term investors, with no signs of structural damage yet.
Short-term corrections should not trigger panic.
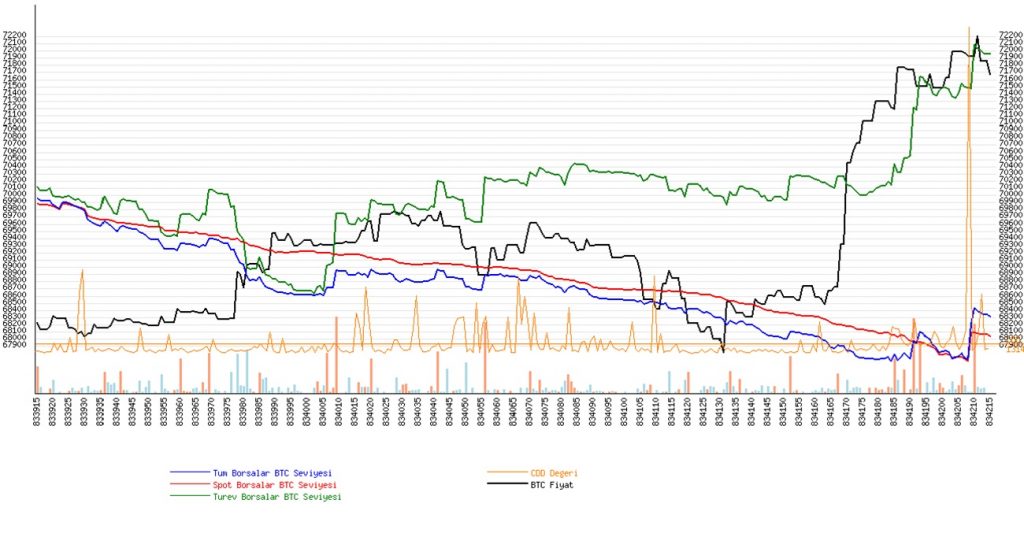
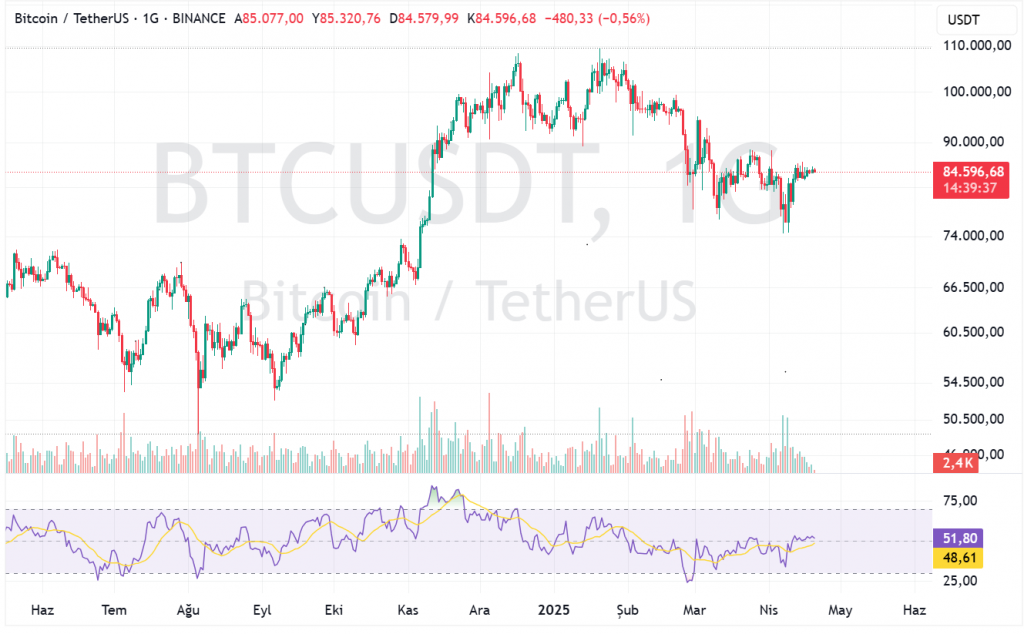
📉 Current BTCUSDT Technical Overview (RSI & Price)
RSI is at the neutral zone (51.80), indicating indecisive momentum.
Price has rebounded from the recent dip but is encountering resistance around the 86K level.
If buying power fades, the 78–80K range could be retested.
RSI is moving sideways — a breakout is needed for directional clarity.
📌 Conclusion & Strategy Recommendation
| Timeframe | Status | Comment |
|---|---|---|
| Short-Term | Neutral-positive | Price above STH RP; no issues unless support breaks. |
| Medium-Term | Leaning strong | STH RP should be used as a guide; staying below is risky. |
| Long-Term | Healthy outlook | Uptrend since 2023 remains intact. |
Strategy:
-
If BTC maintains above 84–86K, the upward move could continue.
-
Daily closes below the STH RP may trigger selling pressure → closely watch it as a support level.
ANALYSIS
🚀Join CDDStamp for free and unlock instant access to these powerful insights — no cost, just alpha.
Bitcoin is currently stuck in the $84,000–$85,000 range, hovering just above the average cost basis of short-term holders (STH Realized Price). This represents both a potential breakout point and a neutral zone.
📌 When the price is above the STH RP, short-term holders are generally in profit, which tends to increase market confidence. However, these same profit levels can also lead to selling pressure. We are right at that tipping point now.
✅ If You Want to Buy Bitcoin…
Don’t rush into a position.
If the price continues to hold above the STH RP (e.g., closes above $86K for a few days), this would confirm an upward breakout. In that case, entry would be safer.
Otherwise, a pullback to the $80K–$82K range is still possible.
Buy in portions.
Instead of entering with a full position, use a 3–4 part buying strategy. For example:
-
25% now
-
25% if the price hits 79K
-
25% if it tests 75K
-
25% if the trend becomes clear and breaks above 86K
If you’re thinking long-term, this region is reasonable.
On the monthly and weekly charts, BTC is still within a constructive trend. The 2-year STH RP serves as strong support.
There may be short-term volatility, but it’s not a bad area for long-term positioning.
❗️ Warning
If you are not using stop-loss or if you’re only thinking short-term, this zone carries some risk, as selling pressure can increase quickly.
Macro factors (post-halving FOMO, ETF news, etc.) may push the price up again this year. However, correction periods will always exist.
📌 Summary
| Objective | Recommendation |
|---|---|
| Short-Term | No clear signal yet, choppy range. A break above 86K allows entry. |
| Mid-Term | $78K–$82K could offer a good buying opportunity. |
| Long-Term | Not very cheap, but still reasonable for long-term investors. |
| Strategy | Buy in portions, be patient, wait for trend confirmation. |