We have previously discussed this topic in a brief article. You can read it here. This way you can understand the topic better.
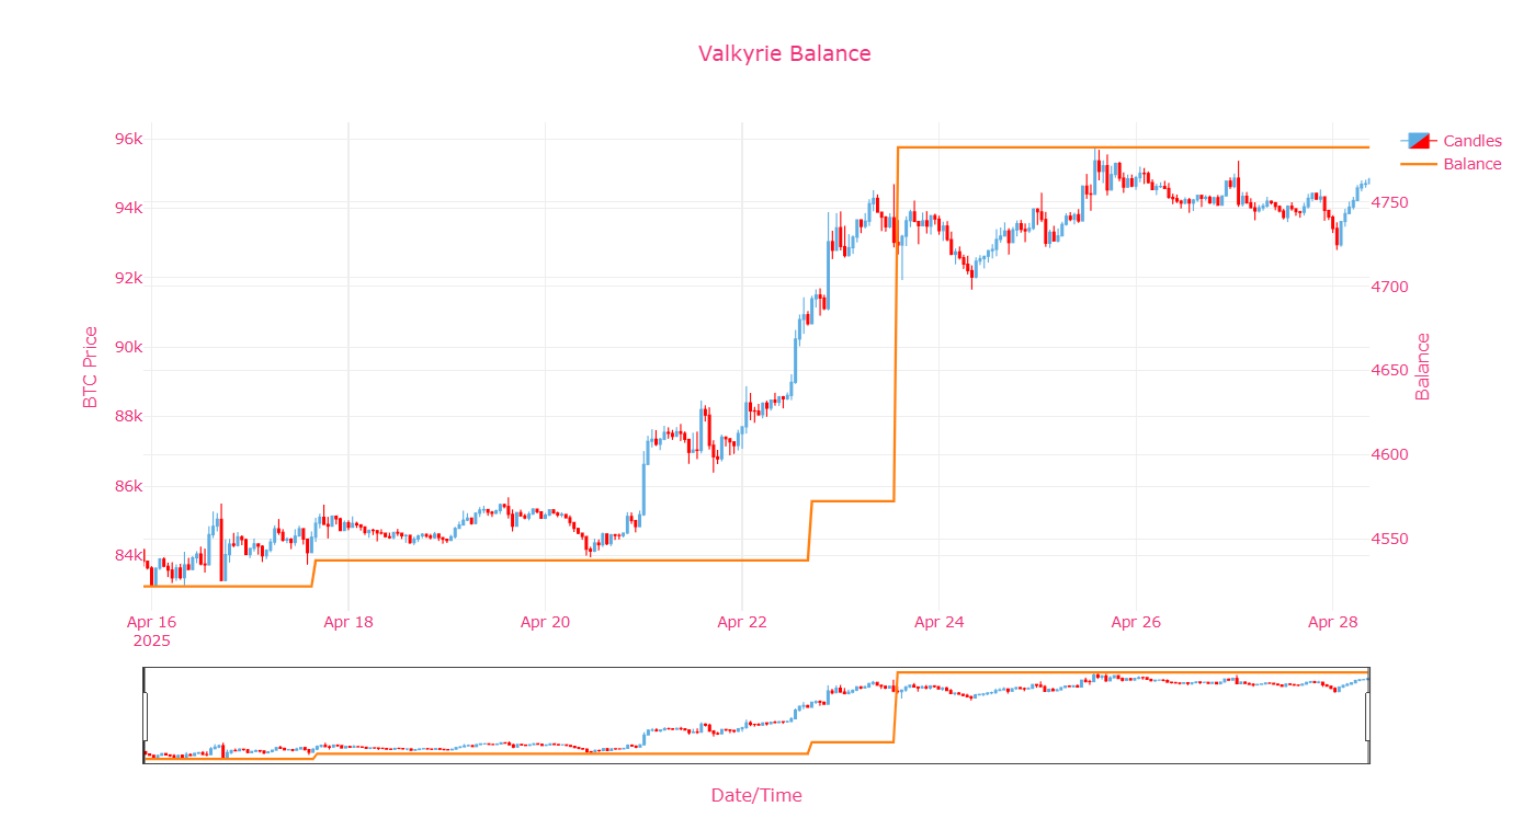
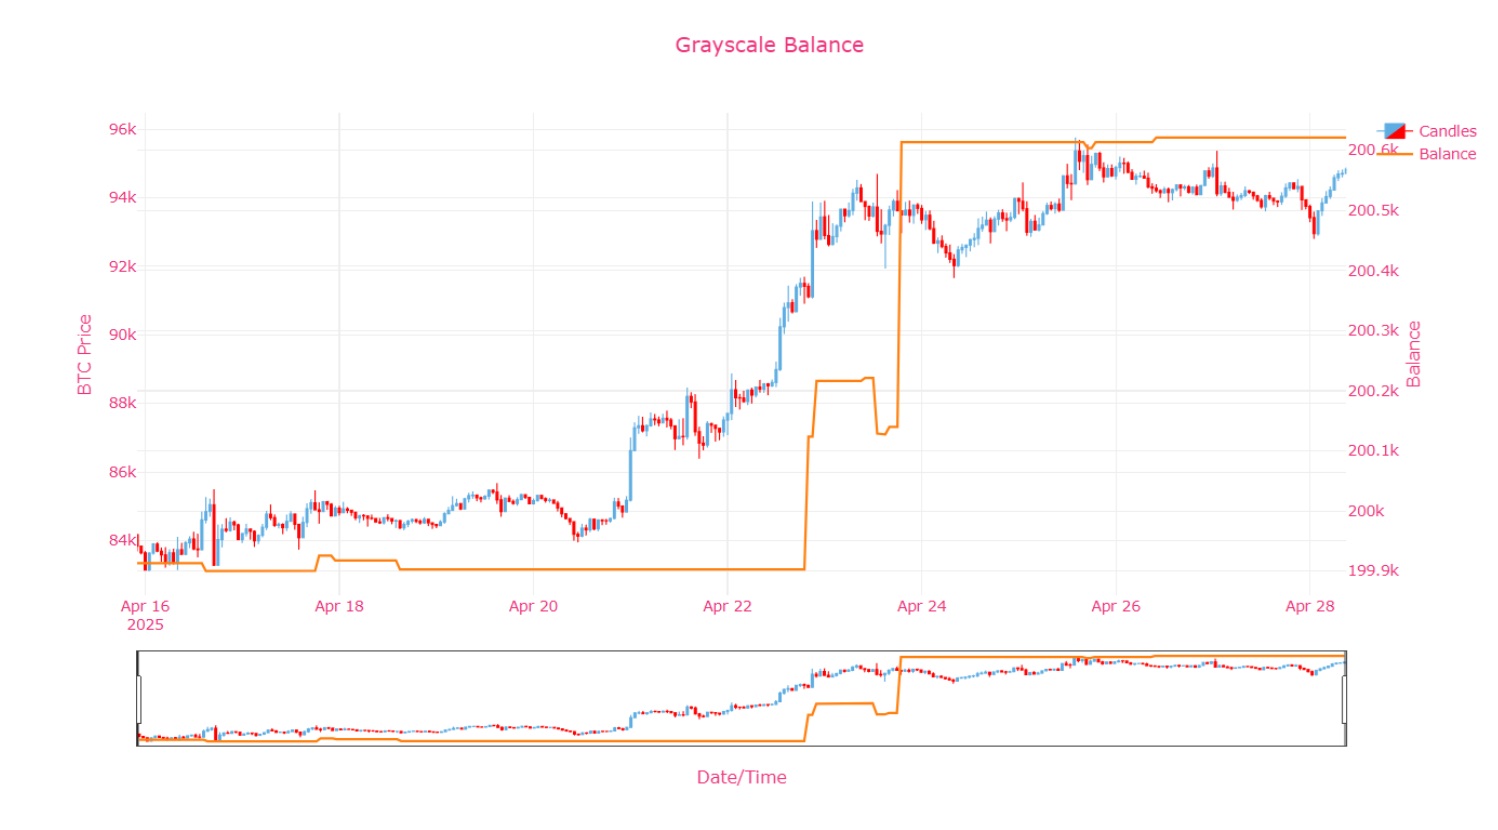
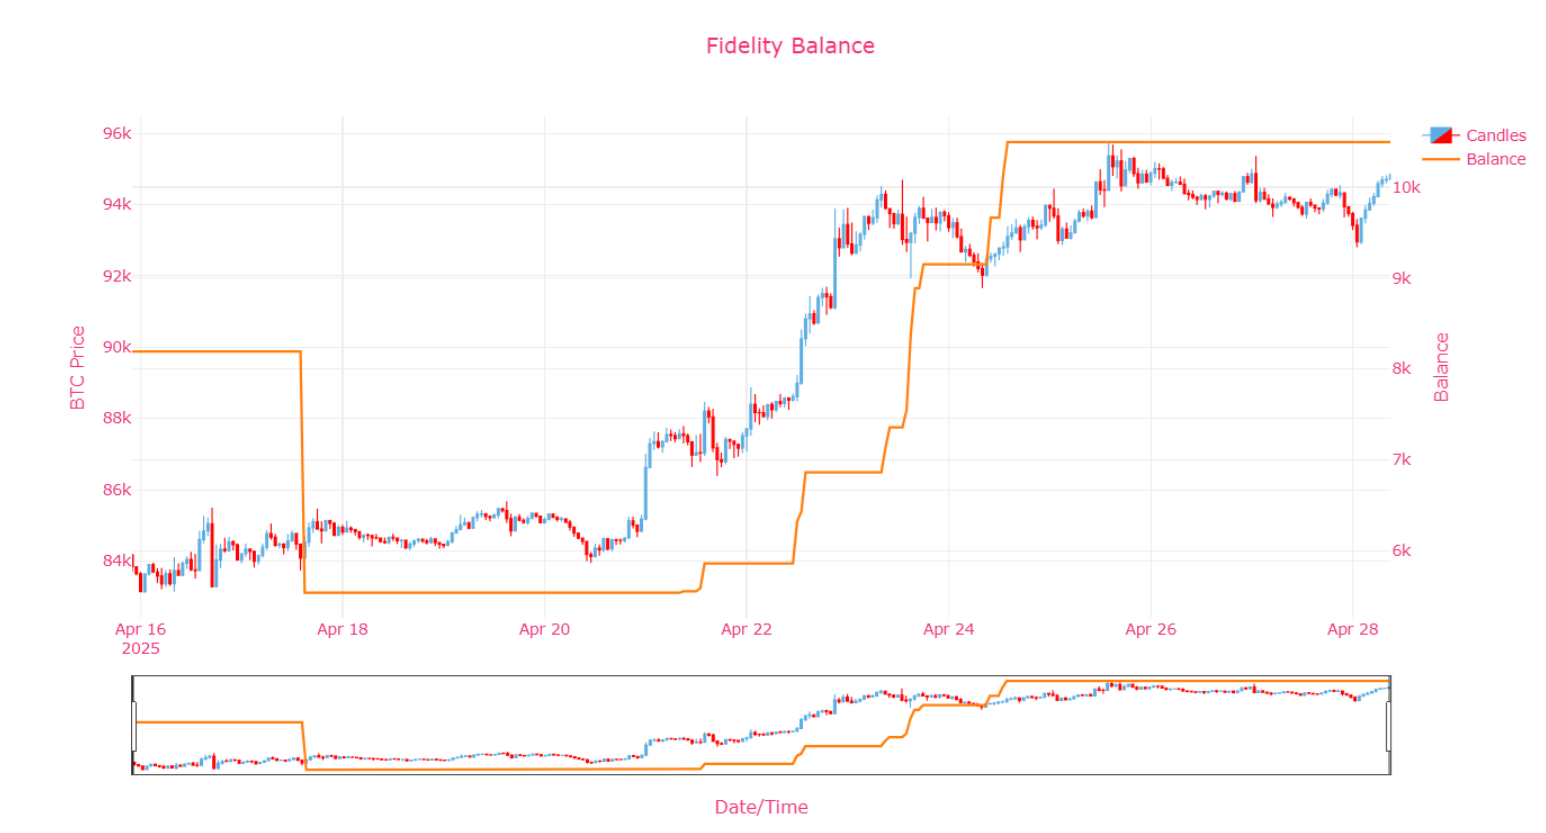
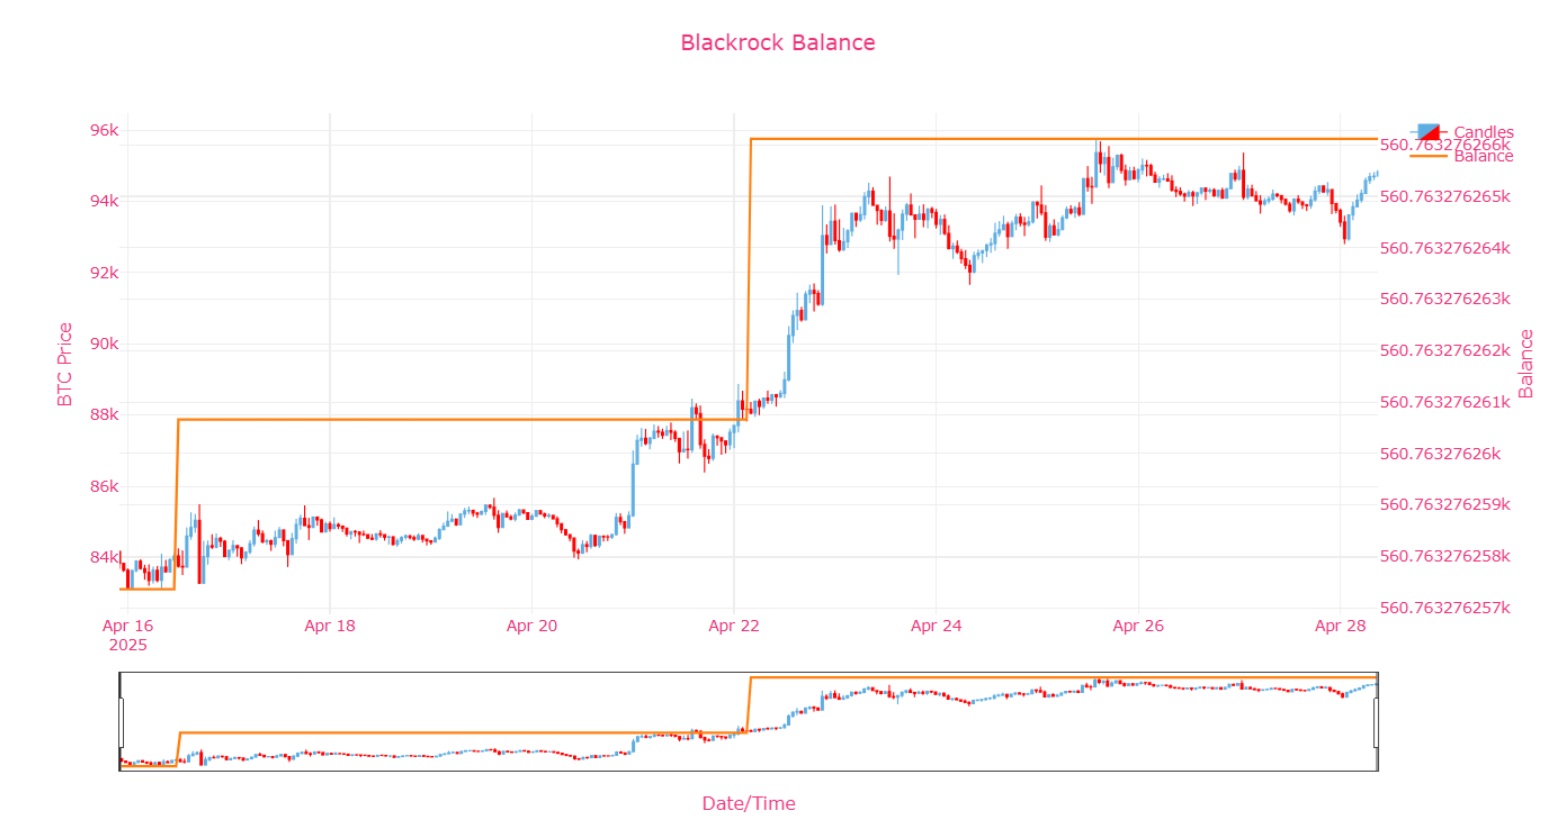
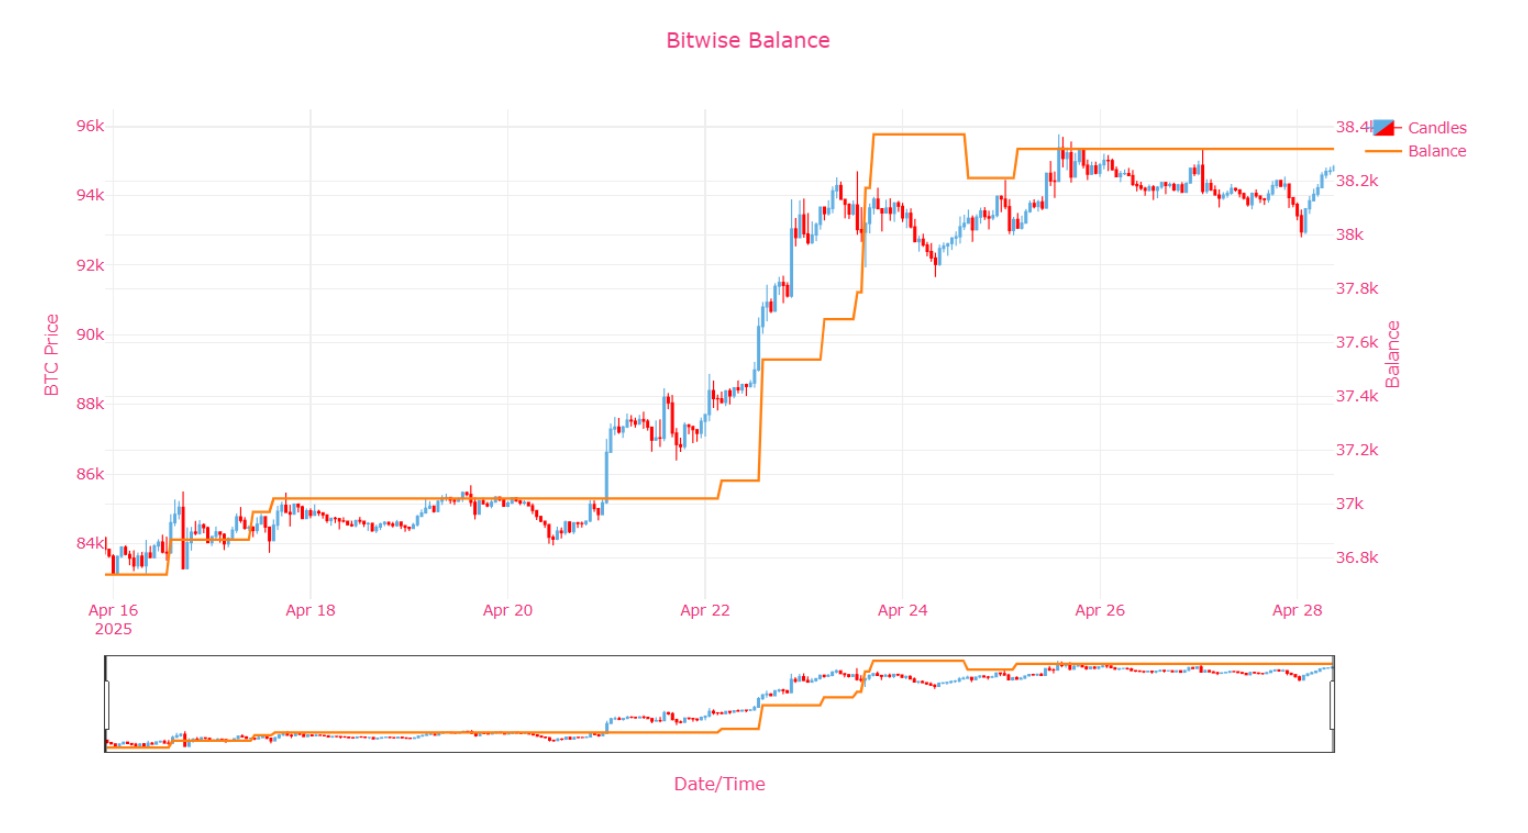
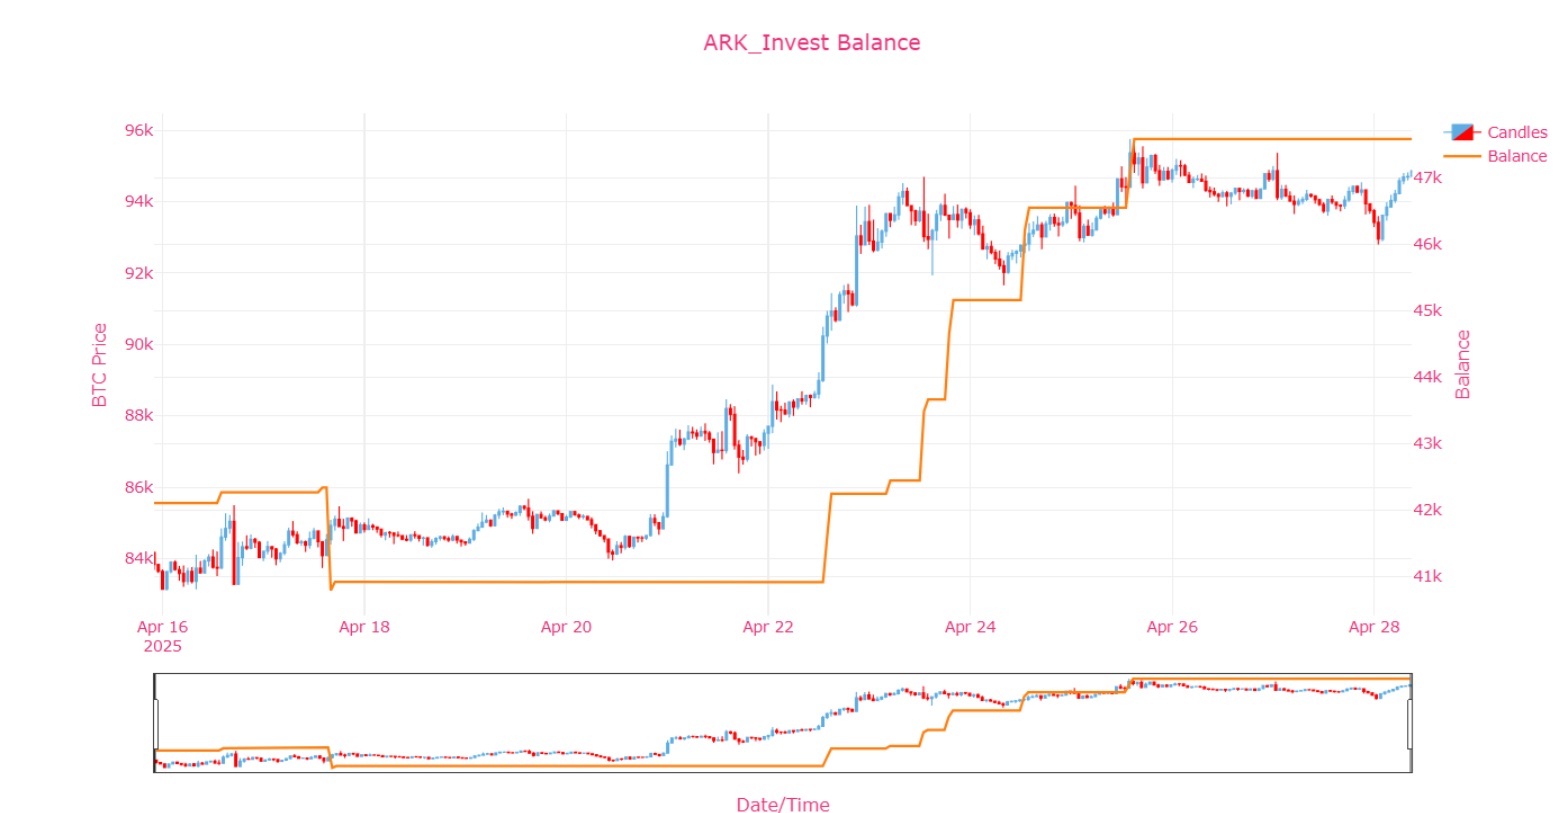
When reviewing recent ETF data (BlackRock, Fidelity, Ark Invest, Grayscale, etc.), the following trends are clearly visible:
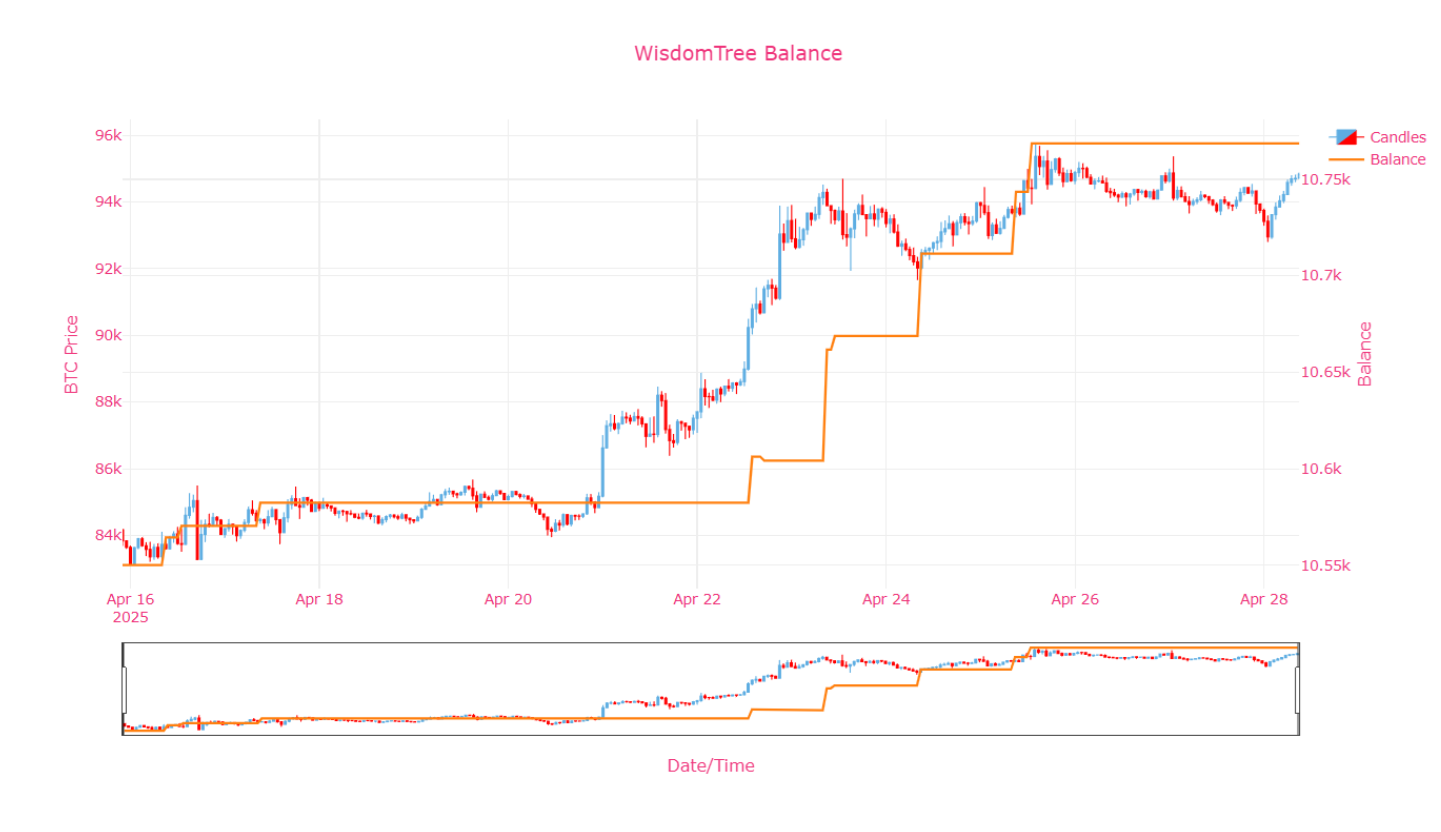
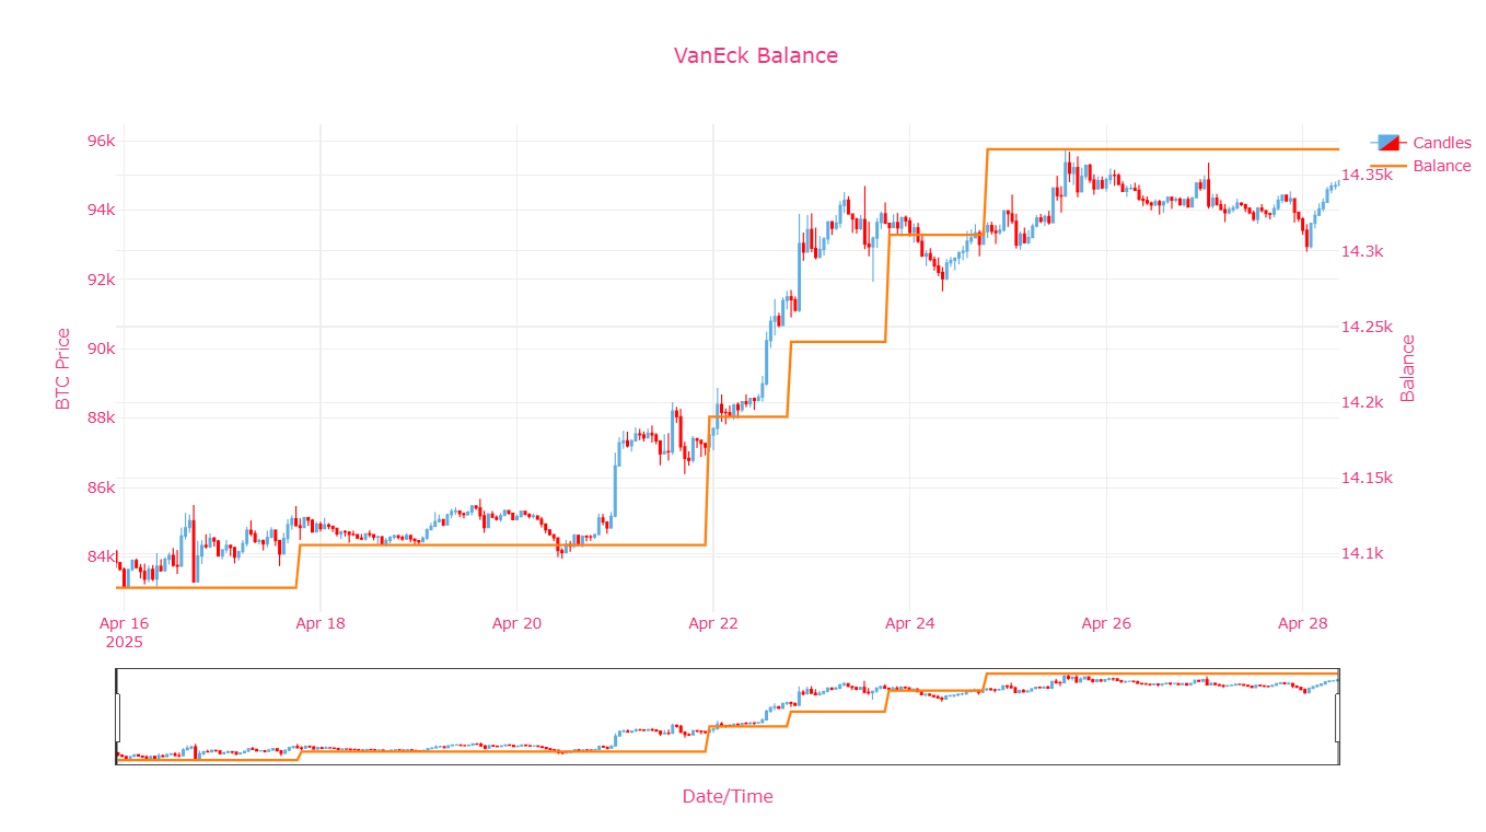
ETF fund balances are increasing → Especially throughout April, major funds like ARK, BlackRock, Bitwise, and Grayscale have gradually increased their Bitcoin holdings.
This rise appears to stem from the transfer of BTC out of older funds like Grayscale into the new ETFs. (This directly supports your article’s theory about “gBTC → ETF transition.”)
In summary: gBTC has been sold for spot BTC, and these BTC were then moved directly into the treasuries of the new ETFs.
🔥 Market Impact
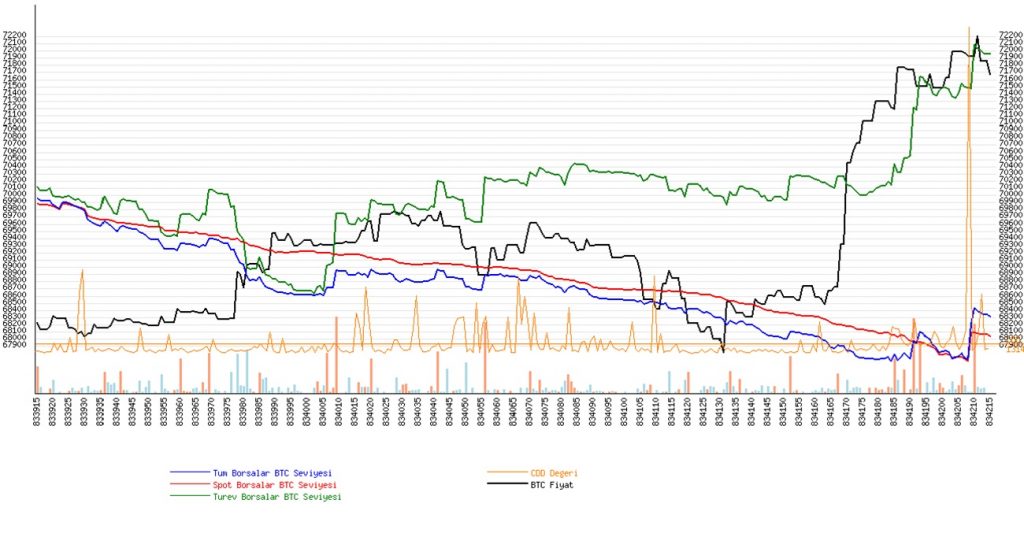
Technically, these transfers appear as net spot purchases because once BTC exits platforms like Coinbase, on-chain data registers it as an “outflow.”
When the market observes these outflows, it interprets them as a “demand signal,” creating upward pressure on the price.
This dynamic seems to have significantly fueled the recent BTC rally (from $75k to $94k).
However…
⚡ Critical Point: Transfers Are Not Infinite
These gBTC-sourced inflows into ETFs are a one-time event.
Once old gBTC investors have shifted their holdings into new ETFs, this flow will dry up.
After that point, ETF growth must rely on real spot demand.
Currently, Bitcoin price is still hovering around $94k, but it’s evident (based on your latest TradingView volume chart) that volumes are weakening.
This indicates that from now on, price movements must rely entirely on organic spot demand.
📊 Conclusion and Warning
So far, the rally has largely been fueled by a liquidity illusion caused by the gBTC → ETF transitions.
We are approaching the end of this phase.
If no fresh spot demand arrives, a price correction may occur.
Conversely, if new, genuine ETF inflows emerge, organic growth could sustain the market.
🧩 Ultra Summary
| Situation | Meaning |
|---|---|
| ETF balances are rising | Positive short-term pressure |
| Volumes are declining | Risk of weak organic demand |
| gBTC → ETF transition ending | True market forces will surface |
| No new demand | Price could face downward pressure |
Bitcoin Price Forecast (as of April 28, 2025)
Current Situation:
BTC transfers into ETFs have mostly been completed, helping price surge toward $94k.
Trading volumes are weakening → No strong new inflows observed.
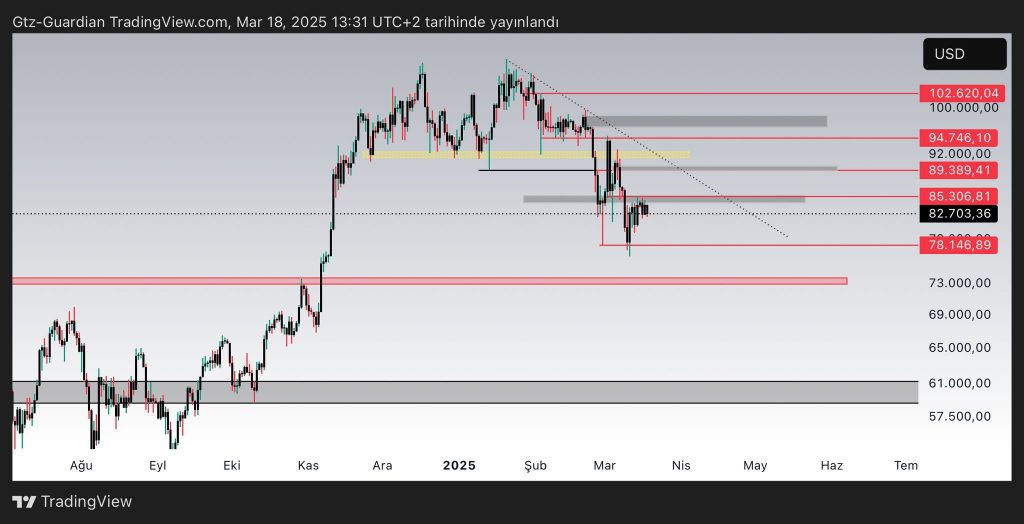
RSI (based on your provided chart) is near 70 → Entering overbought territory.
🎯 My Expectation:
In the short term (within the next 1–2 weeks), Bitcoin is likely to undergo a correction.
Target Zones:
First support: $90,000 – $91,000
Wider support: $87,000 – $88,000
Thus, a potential retracement of approximately 5%–8% from current levels seems quite likely.
📊 Why?
The pseudo-spot demand effect from ETF transfers is diminishing.
Genuine spot buyers are not showing strong momentum yet (volume support is lacking).
RSI indicates technical cooling is needed after overbought conditions.
🚀 What Comes After:
If Bitcoin retraces to the $87k–$90k range and establishes a solid base there, a new rally based on real spot demand could emerge.
📊 Bitcoin End of April – Early May 2025 Probability Table
| Scenario | Description | Probability (%) |
|---|---|---|
| 🔵 Minor correction (testing 90k–91k support) | Volume is declining, RSI is high → a technical cooldown and minor pullback likely | 45% |
| 🟠 Medium correction (testing deeper 87k–88k support) | ETF transition impact fades completely, no strong new spot demand appears | 30% |
| 🟢 Consolidation (ranging between 93k–96k) | ETF inflows continue modestly, or weak spot demand maintains sideways action | 15% |
| 🔴 Immediate breakout to new highs (rally towards 100k) | Unexpected strong spot buying or positive surprise news (e.g., new ETF filing) | 10% |
🎯 Ultra Summary:
There is a 75% probability that BTC will face some sort of correction first (either minor or medium).
A 15% probability that BTC will consolidate sideways (without strong upward or downward movement).
A 10% low probability that BTC immediately breaks out to new highs (100k+), which would require a major catalyst.
🧠 Why These Probabilities?
Declining volume → increases the likelihood of correction.
RSI is nearing overbought territory → technical cooling expected.
ETF flows, mainly from gBTC transitions, are nearing completion → temporary spot demand impact fading.
No major bullish news at present → lowers immediate breakout chance.
However, overall market sentiment remains bullish → sideways consolidation remains a real possibility.
If you want, I can now build on this with:
Laddered buying strategy (which levels to accumulate BTC),
Stop-loss and risk management suggestions,
Mid-to-late May price targets.
Final: Bitcoin’s recent surge to $94K was largely driven by gBTC to ETF transitions. As these flows dry up, organic demand must take over. A short-term correction to $87K–$90K may be ahead.
⚠️ Important Notice:
This study is solely an evaluation based on data analysis and personal interpretations.
It does not constitute investment advice in any way.
Investments carry risk; you are strongly advised to conduct your own research before making any investment decisions.