 Sign up for free on CDDStamp today and get one-month access to our AI predictor, sezAI, for crypto and stock market forecasts.
The Chicago Mercantile Exchange (CME) is one of the largest financial derivatives exchanges in the United States. While it’s primarily known for traditional assets like stocks and commodities, CME also offers trading in Bitcoin-based derivatives. Traders can open both long and short positions on Bitcoin futures through CME, making it a key platform for institutional crypto exposure.
Since CME operates like a traditional exchange, it follows standard business hours—opening every Monday at 01:00 AM (Istanbul Time) and closing Friday at 00:00 AM. It remains closed on U.S. public holidays. Additionally, on the last Friday of each month, many Bitcoin options contracts expire, typically representing nearly $4 billion in notional value.
Why CME Data Matters for Crypto Traders
There are several strategic advantages to tracking BTC price data via CME:
-
Correlation between crypto and U.S. equity markets
-
Insights into market sentiment by examining the size and direction (long vs. short) of monthly options
-
Most importantly: identifying price gaps (GAPs) on CME charts that may act as future support or resistance levels
Among these, gap tracking is especially critical. So, what exactly is a gap?
Sign up for free on CDDStamp today and get one-month access to our AI predictor, sezAI, for crypto and stock market forecasts.
Understanding Gaps in Price Action
A gap refers to the difference between the closing price of one session and the opening price of the next, especially when no trading activity occurs in between. On CME charts, gaps often act as magnets for price action, meaning they tend to get “filled” over time.
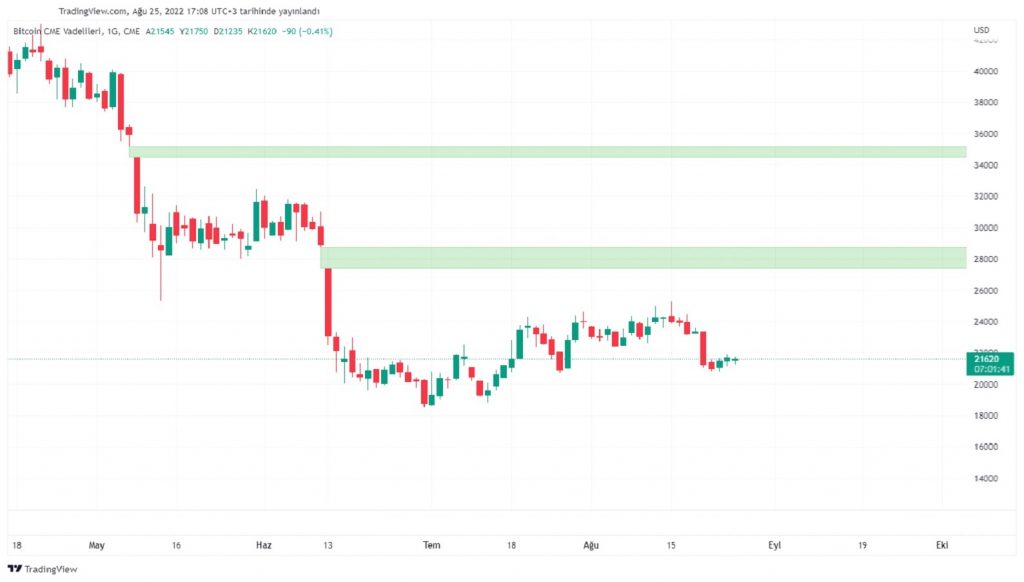
Currently, there are two significant gaps on the CME Bitcoin futures daily chart:
-
The first lies between $27,365 and $28,740, formed during the June market crash following the Celsius collapse.
-
The second, between $34,445 and $35,180, was created amid the infamous LUNA collapse.
Both zones now act as resistance levels, technically speaking. However, gaps can also form below the current price, potentially drawing Bitcoin lower in the medium to long term.
Following Option Volumes for Market Sentiment
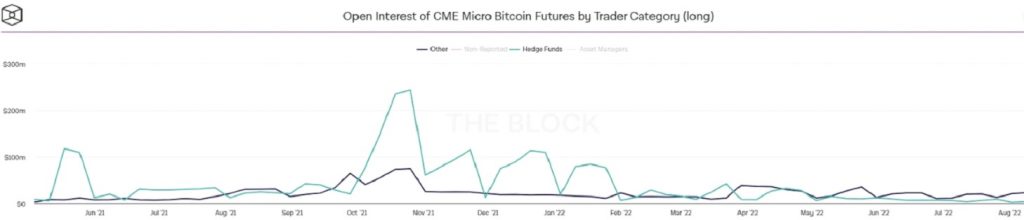
Another valuable indicator is the volume and distribution of open Bitcoin options on CME. You can monitor this using platforms like Coinglass or TheBlock.
Recent data shows a notable drop in options volume over the past 10 months. For example, in late November, open interest on long positions stood at around $230 million, while short positions exceeded $350 million. While not a definitive bearish signal on its own, such imbalances can foreshadow corrections.
At present, it’s difficult to draw clear directional conclusions from open interest data alone. However, as we head into the fourth quarter, the volume and positioning of new contracts may offer better clarity. For instance, August contracts are nearing expiration and currently skew bearish, while September’s new contracts could shift that outlook.